
At our Investor Updates we noted how, in typical fashion, world share markets have been wobbling around, reacting to a series of events and news flashes both positive and negative, then ending up pretty much where they were a year ago. In fact the chart showing market price movement since the beginning of March last year looks like this:
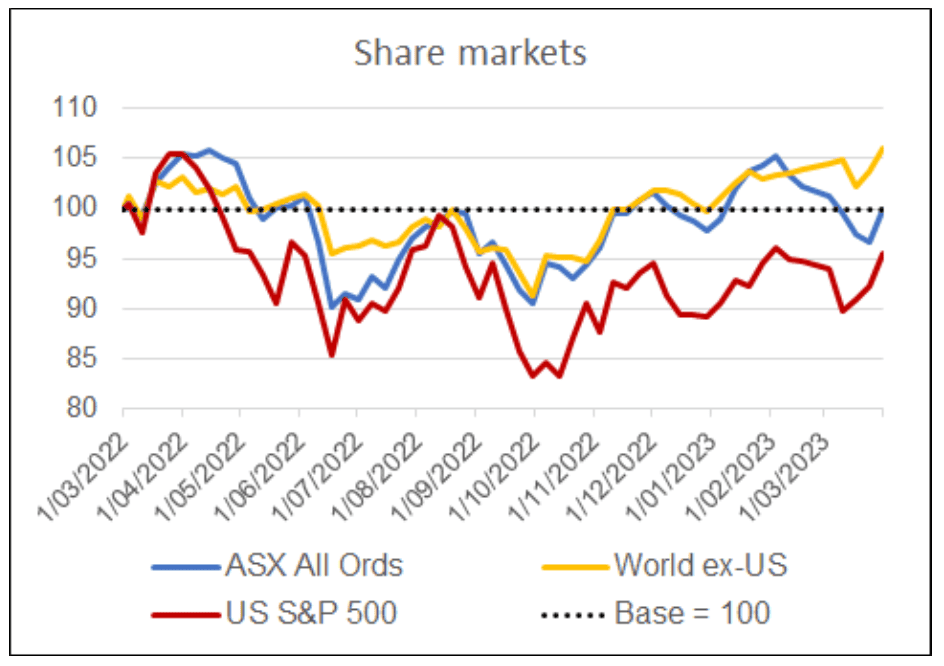
So notwithstanding falls here and there of 10- 15%, by the end of March most markets were within spitting distance of where they were back then.
But note the key words in that intro : “Market price movement”. That is, a reflection of how share prices move on a daily basis according to the sentiment of market participants at the time. In a number of ways, notwithstanding the enormous amount of media coverage such things get (and the fact I’ve already spent half a column on it myself!), this is only part of the story.
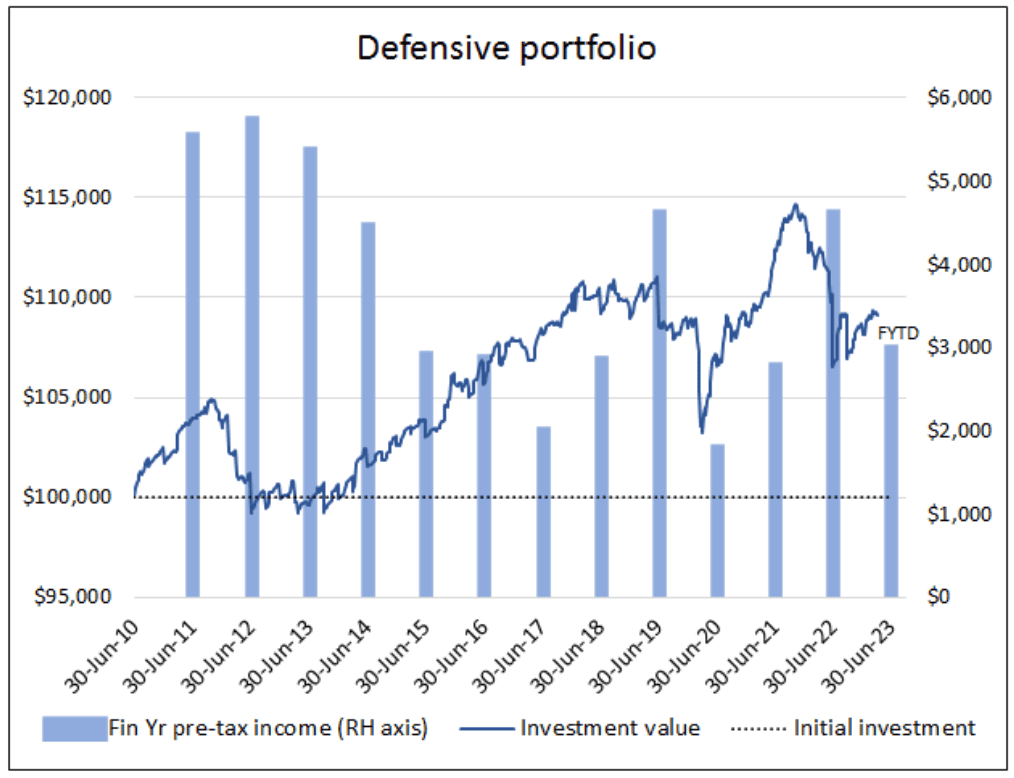
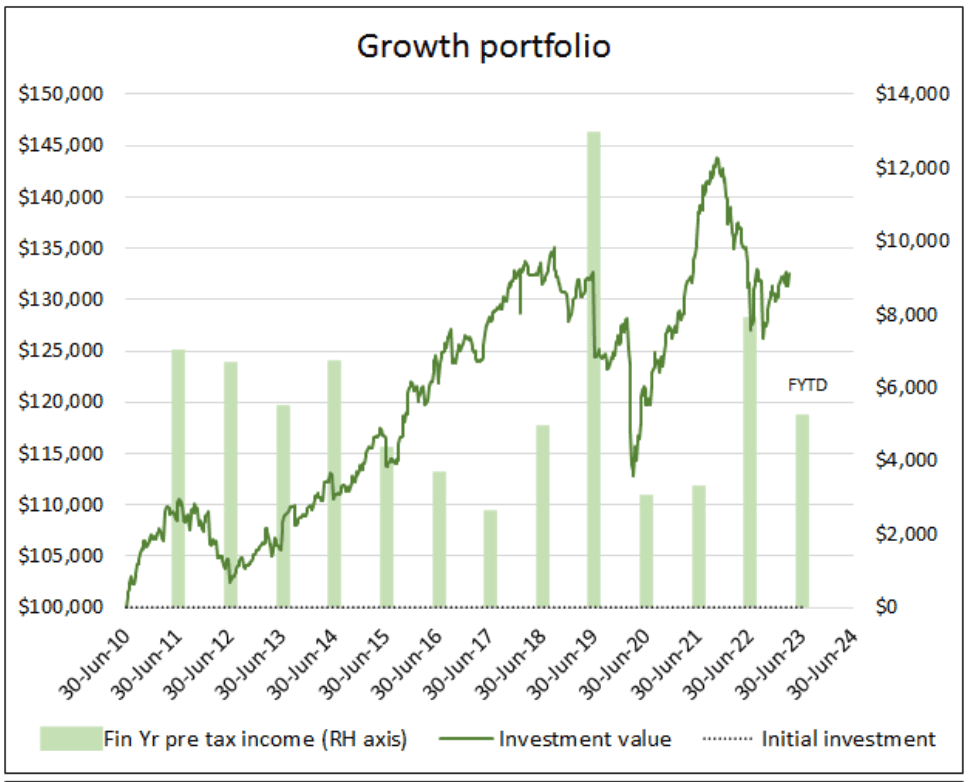
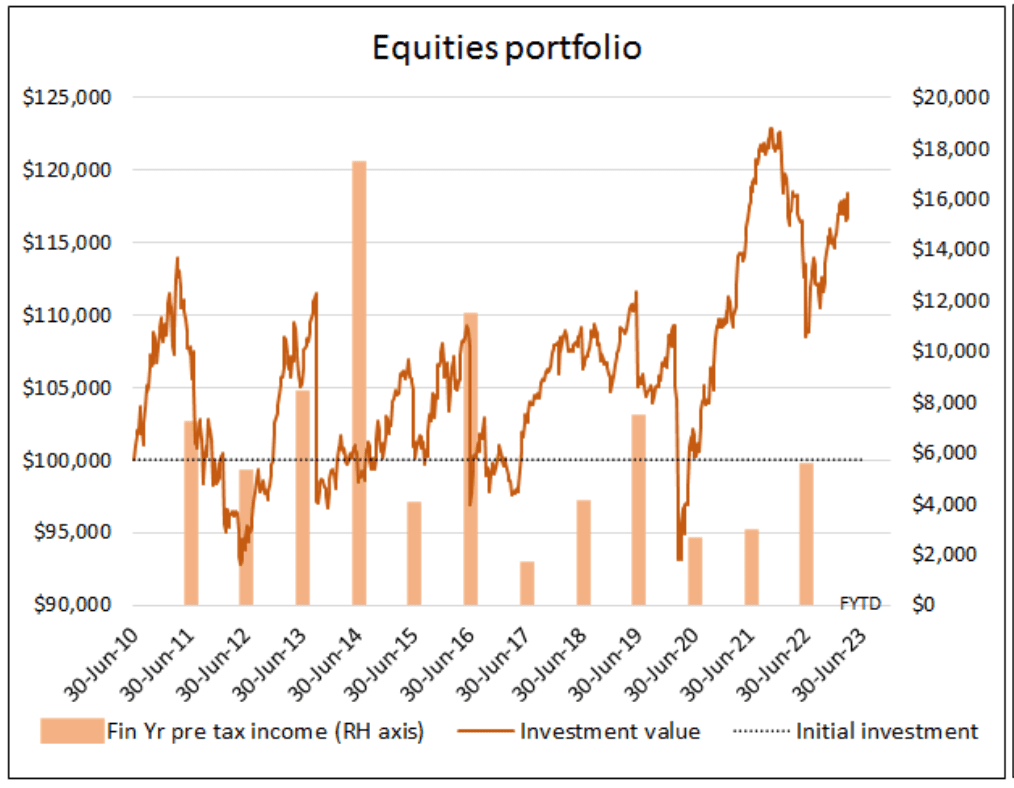
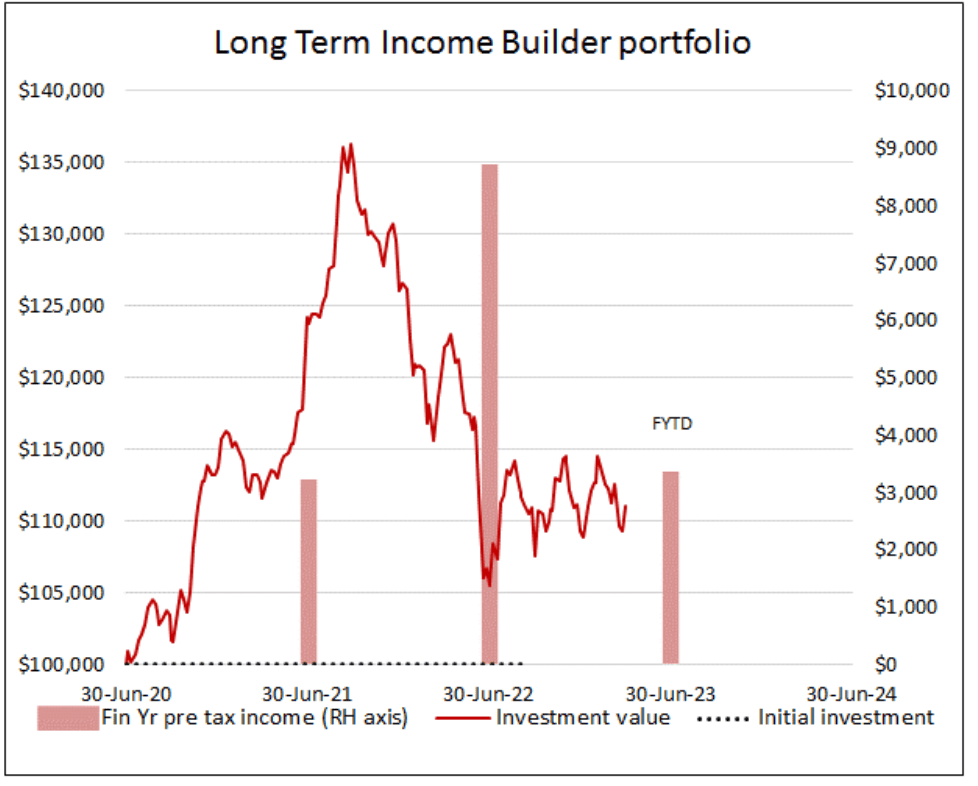
As we discussed at the Updates, investments also pay income, detail of which tends to get swamped by the news cycle and its focus on daily prices. Which is why, as well as the table of total returns, we now also show the two components of the return generated by the portfolios – the price movement and the annual income return. The charts depict the return from a hypothetical investment of $100,000, with the line representing the value of the portfolio as it follows the fluctuating unit price. While the vertical bars represent the income paid out along the way, including franking credits. It’s notable that income is distributed every year, regardless of the underlying movement in portfolio value.
Of course we are still very conscious of the potential volatility in prices and adopt a strategy, particularly in the Defensive and Growth portfolios, which aims to dampen this volatility. It’s also true that if you don’t have to sell assets at a particular time, your risk from fluctuating prices is greatly diminished. Price only matters when you buy and when you sell. If things are set up prudently you can avoid the risk of having to sell things at a bad time to help pay the bills, which otherwise may mean crystallising losses that can never be regained. You can instead ride out the price fluctuations and if necessary sell at the right times.
Hence why we also advocate a “bucket” strategy in advising investors on their portfolio mix. The aim is to ensure you have enough in the most stable portfolios to meet income needs for a number of years, reducing the chance of having to sell assets during a severe downturn. Our upgraded projection software specifically focuses on a better understanding of investors’ cash flow needs with the aim of further refining their ideal portfolio mix. Let us know if you’d like us to crunch your numbers.
HUB24
At the Investor Updates the question was raised about HUB24 and what role it plays in setting and managing the Fund’s investment strategy.
The answer is “None”. HUB24 operates a sophisticated fund administration programme – a giant piece of software that manages investors’ accounts, processes transactions, records and distributes investors’ share of returns generated, ensures the payment of pensions and withdrawals, and produces members’ account statements.
HUB24 undertakes that role for ARA Super, and Fundhost Ltd undertakes that role for the ARA Investment Fund. ARA retains sole responsibility for implementing investment strategy through its role as investment manager.
We trust this is clear. Please let us know if you want further explanation.
So, who’s got what?
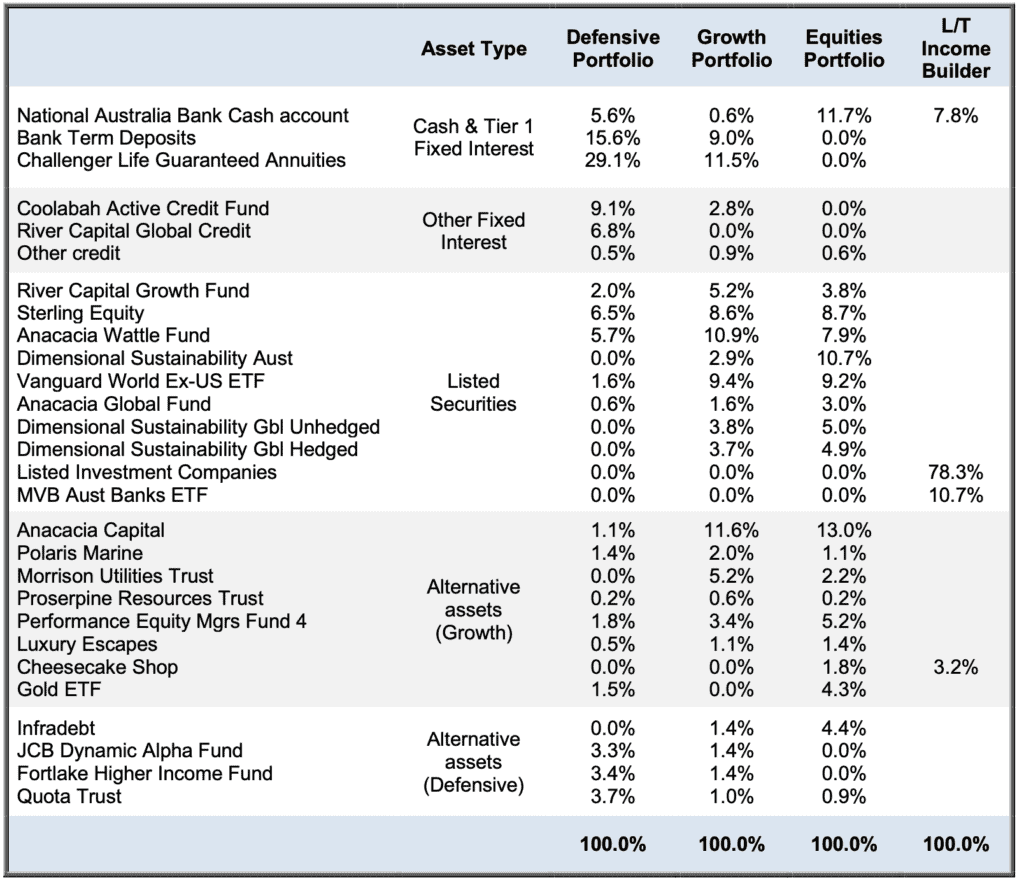
The table below shows the ARAIF’s investments at the time of writing. Please note, the percentages refer to the proportion of each portfolio allocated to that investment, not its rate of return.
Major Holdings – diversified portfolios
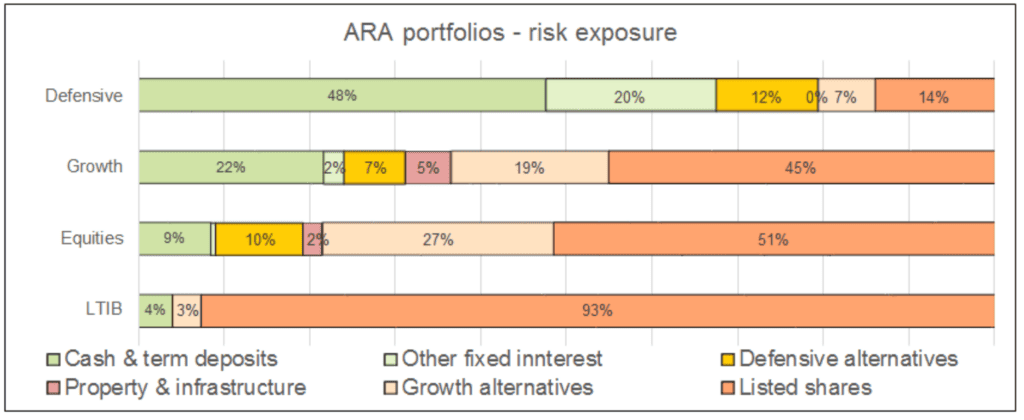
Apart from bank deposits and other interest-bearing accounts, Defensive, Growth and Equities portfolios invest in a range of assets through the fund managers listed in the table above. If we drill through to the assets selected and overseen by those managers, there are in fact over a hundred individual securities providing diversification of risk and exposure to a wide range of opportunities.
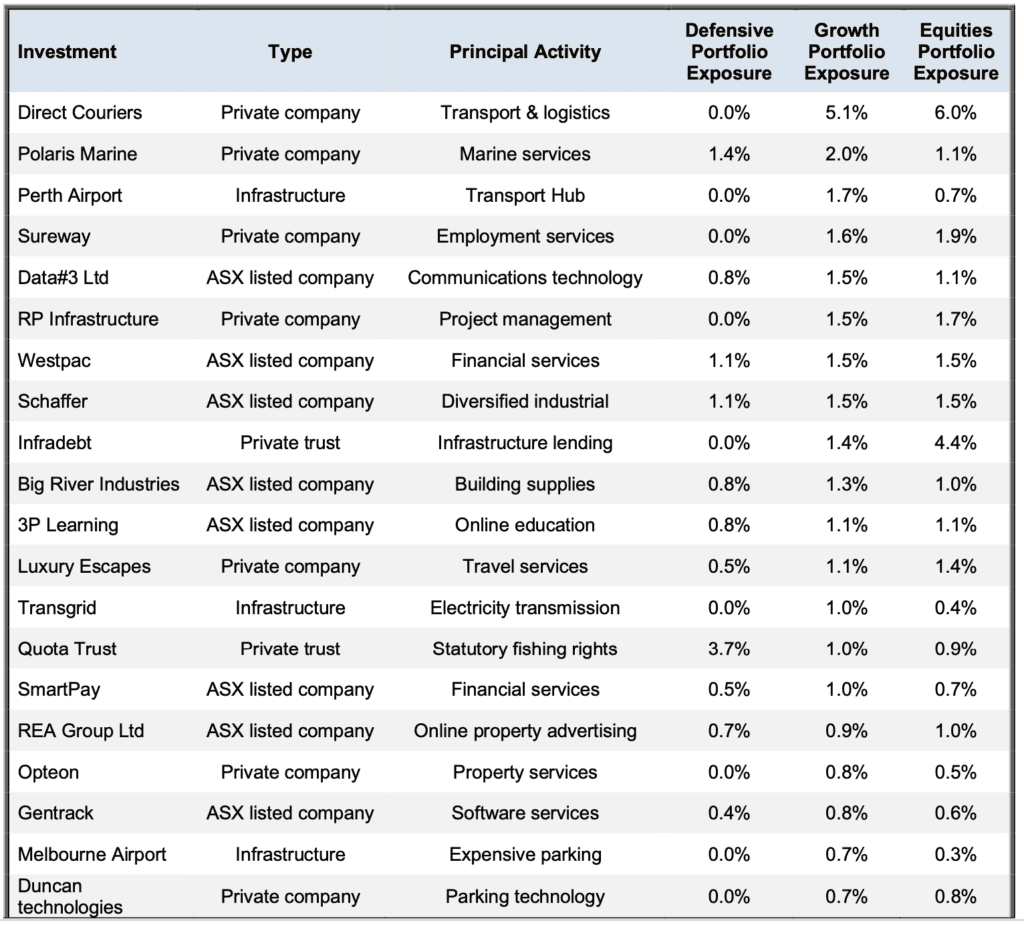
The table below shows the 20 largest individual holdings and what proportion of each portfolio they represent. These are the investments that will have the biggest impact on the portfolios’ returns.
Returns quoted in this report are after all costs, and before the application of management fee rebates. Return figures are pre-tax, and include the value of franking credits from franked dividends. Total return figures assume the re-investment of gross distributions including franking credits. 3-month return figures are for the period to 31 March 2023 and are not annualized.
ARA Consultants Limited provides this update for the information of its clients and associates.
This document has been issued by ARA Consultants Limited for its own use and the use of its clients. Fundhost Limited (ABN 69 092 517 087) (AFSL No: 233 045) (Fundhost) is the issuer of the ARA Investment Fund (ARSN:104 232 448). Information contained in this document is general information and is not intended to constitute nor does it purport to offer any specific or individual investment advice. Whilst every effort has been made to ensure the accuracy of the information contained in this document, neither ARA nor Fundhost accept any liability in relation to anyone who makes and acts upon a dec ision based upon that information. No person should make a decision based upon the information contained in this document without first seeking and obtaining the appropriate professional advice relevant to their own individual circumstances and financial needs. You should consider the Product Disclosure Statement in deciding whether to acquire, or continue to hold the product. The PDS and applicable Target Market Determinations are available at www.araconsultants.com.au or by contacting ARA by phone on (03) 9853 1688 or by email at info@araconsultants.com.au. We also caution that past returns are just that, and the fact that they have been achieved previously does not guarantee or imply that they will be achieved again.
If you would like a pdf version of this update for your files you can download it here: March 2023 Quarter Investment Update.
