

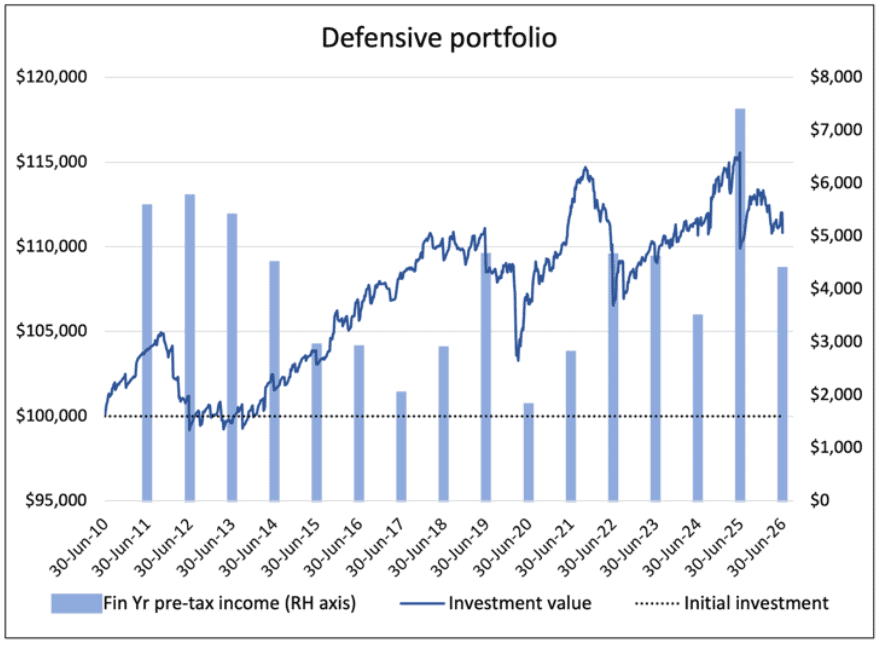
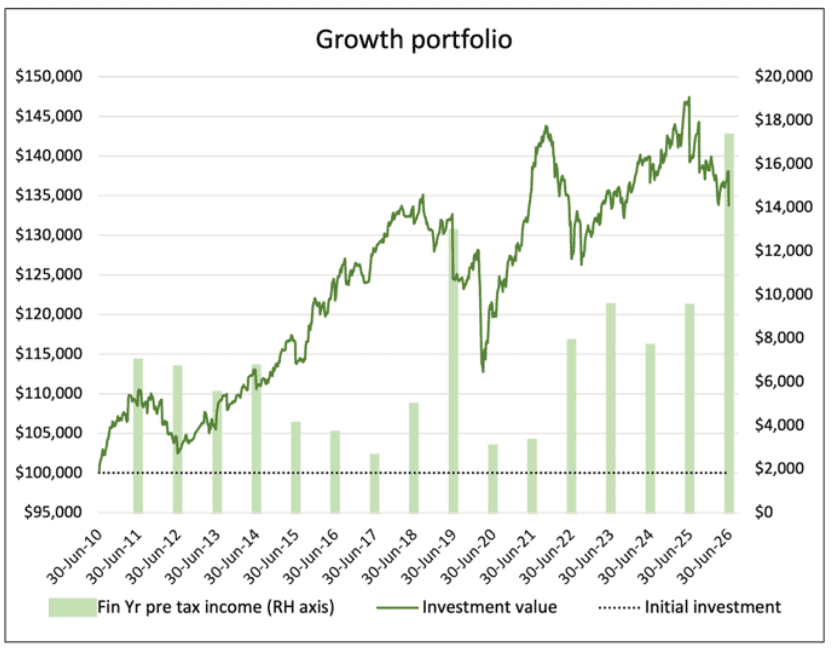
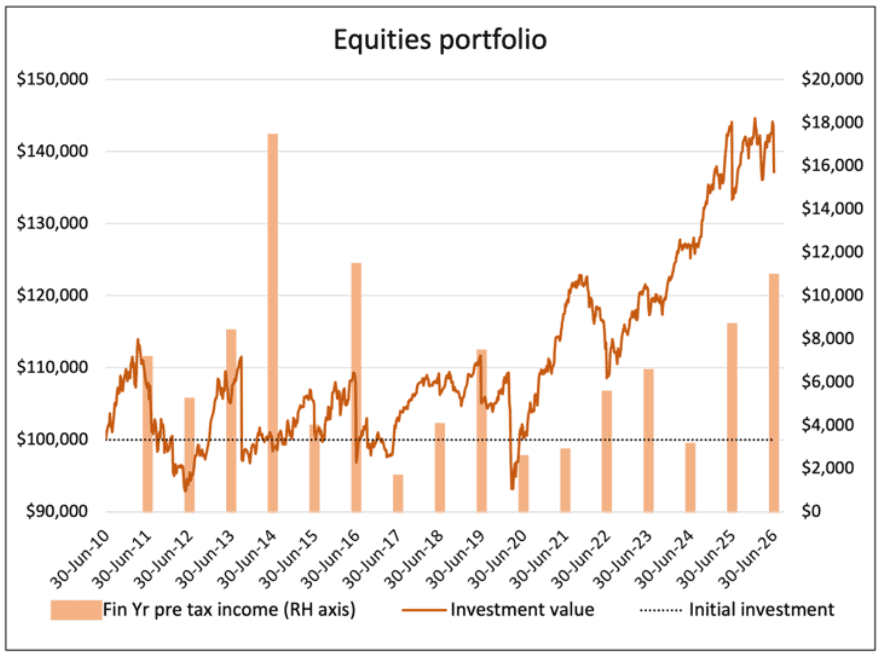
Alert investors will note that the income yield from all portfolios was again quite high this past year. Here’s an updated chart showing just the income paid from each portfolio over the past 16 years, compared with bank deposits. While it’s nice to note that all portfolios nearly always “beat the bank”, it does raise some questions. Like why? And why do Equities and Growth usually yield better than Defensive, and fluctuate so much?
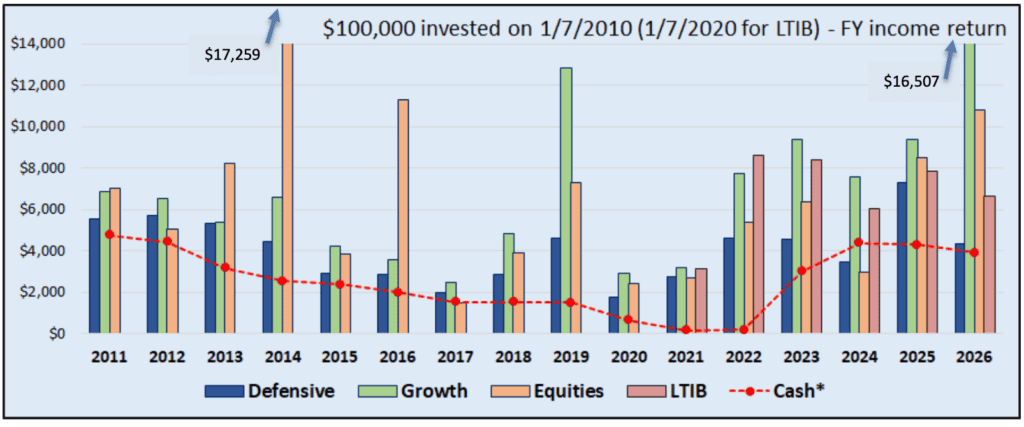
The distributions paid by the Investment Fund portfolios include two major components:
- Income earned by the fund’s investments – interest from bank deposits and the like, and dividends from shares. These charts include the value of franking credits; plus
- Capital gains made upon the sale of assets. That is, if something is sold at a profit, that gain is paid out to investors.
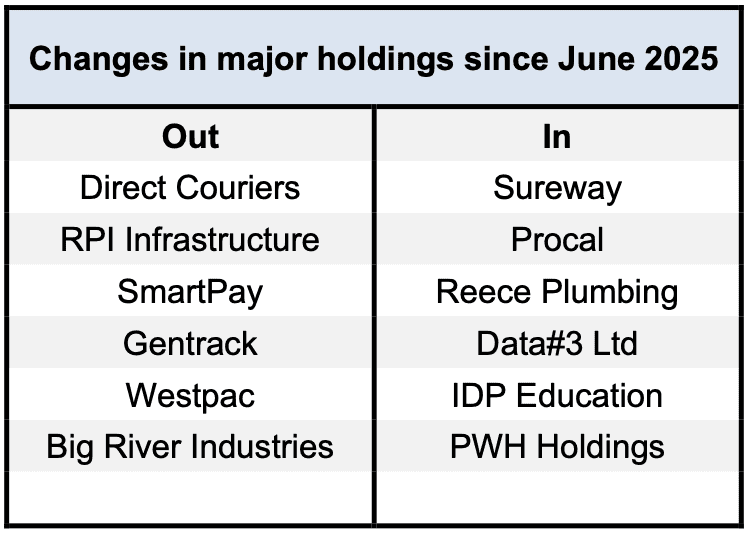
The past year has been another busy one for managers taking profits from things that have run hard or reached a happy selling point. Looking at the list of the Top 20 holdings later in the report, compared with that from June 2025, reveals that 6 of the 20 from last year have been sold or reduced to the point of being banished from the Top 20, making way for new entrants.
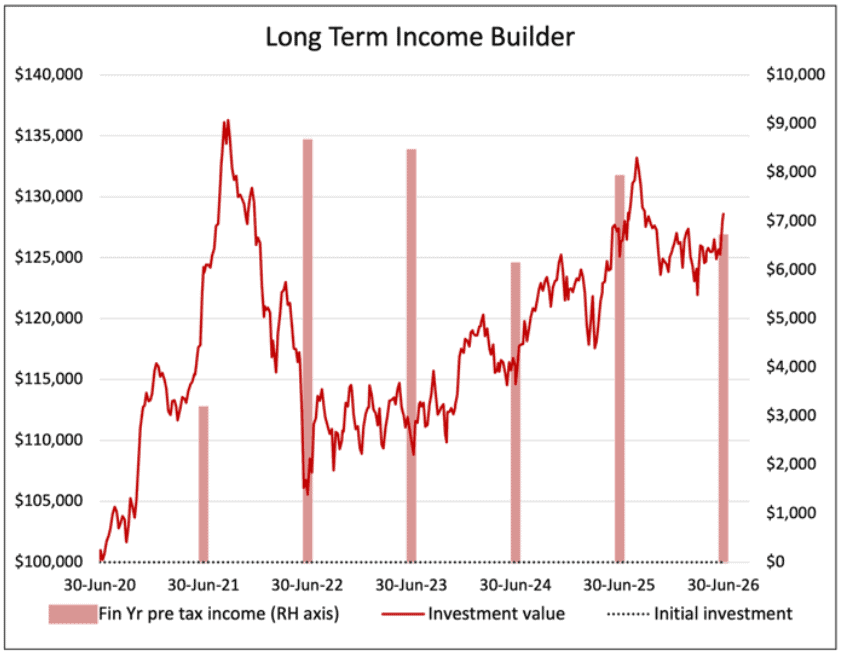
This crystallises significant profits, which are then available for distribution. As you might expect given their make-up, this happens to a greater extent in the more growth-oriented portfolios. And it will vary from year-to-year, depending on whether the markets are throwing up good selling opportunities. Whereas Defensive is more based on interest-bearing deposits with capital stability, and the Long Term Income Builder is more of buy-and-hold strategy focusing on dividend income and so is less inclined to fluctuate.
Turning over 6 out of 20 holdings in a year is a fair bit, more than you would normally expect. The fact that it happens though should be seen as a good thing, a natural consequence of a deliberate strategy of active management. It helps answer the question “Should I be buying or selling or switching?”. The fund managers are on that, making those decisions for you every day.
Income payments and the extent to which they meet your short, medium and long term cash requirements are central to the philosophy we adopt in recommending the right portfolio mix for each individual investor – the “Buckets” approach. If it happens that larger than expected income payments have left you flush with cash, of course the option exists to tip some back in and re-balance the buckets. Give us a call if you want some advice on that one.
So, who’s got what?
The table below shows the ARAIF’s investments at the time of writing. Please note, the percentages refer to the proportion of each portfolio allocated to that investment, not its rate of return.
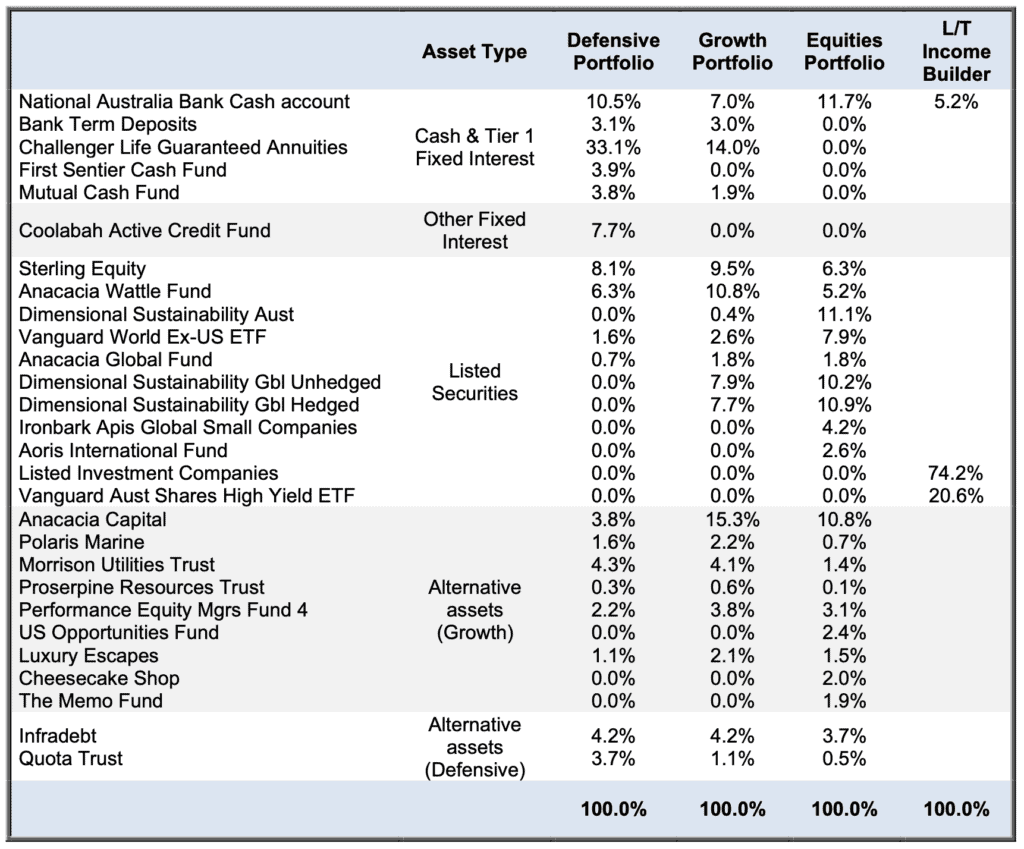
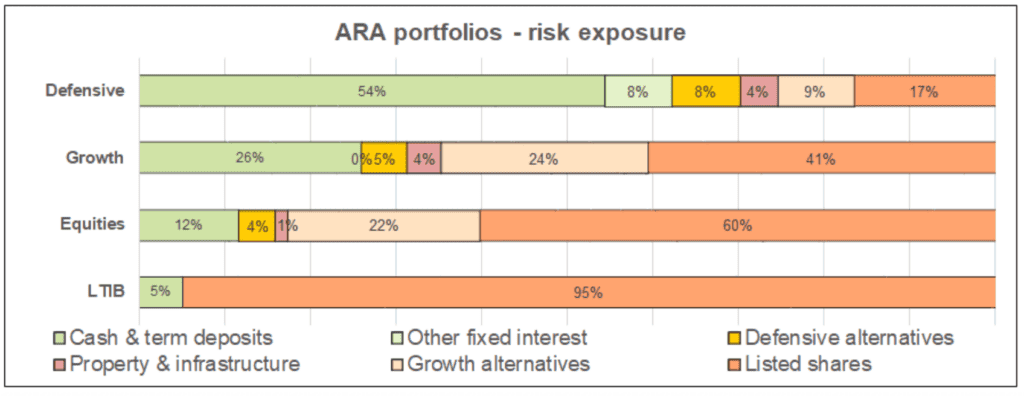
Major Holdings – diversified portfolios
Apart from bank deposits and other interest-bearing accounts, Defensive, Growth and Equities portfolios invest in a range of assets through the fund managers listed in the table above. If we drill through to the assets selected and overseen by those managers, there are in fact over a hundred individual securities providing diversification of risk and exposure to a wide range of opportunities.
The table below shows the 20 largest individual holdings and what proportion of each portfolio they represent. These are the investments that will have the biggest impact on the portfolios’ returns.
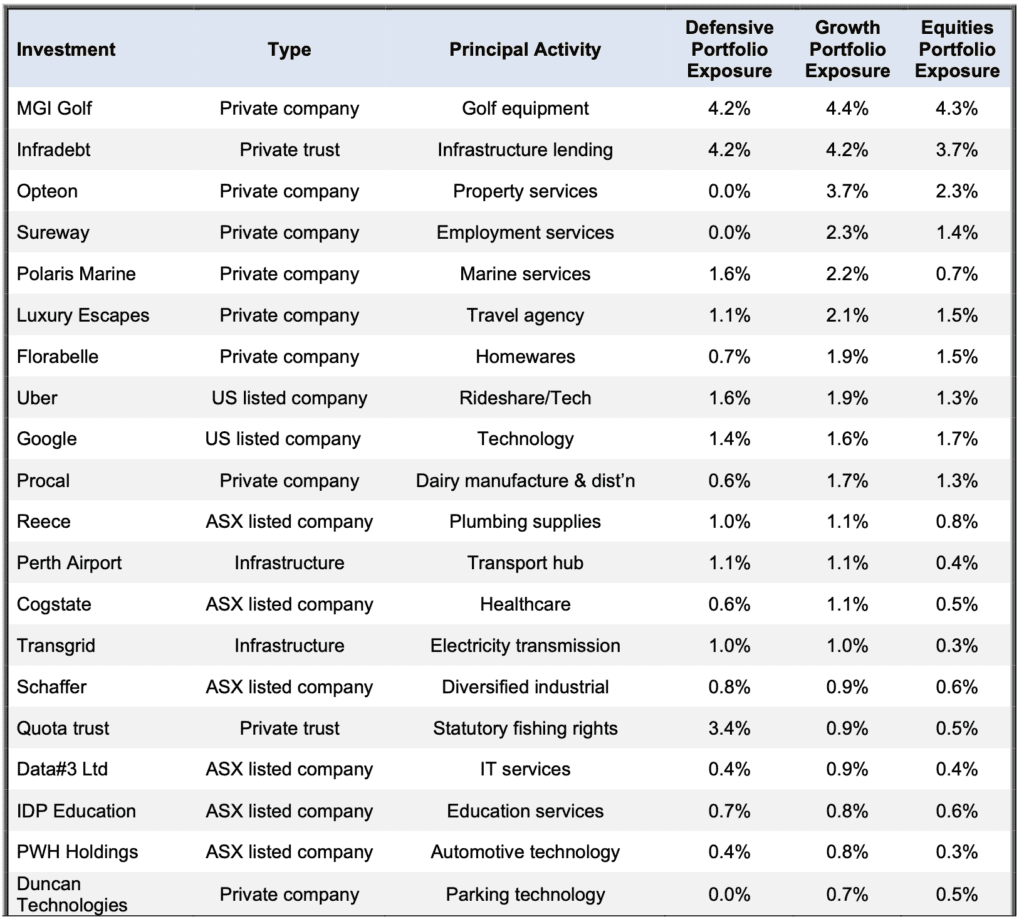
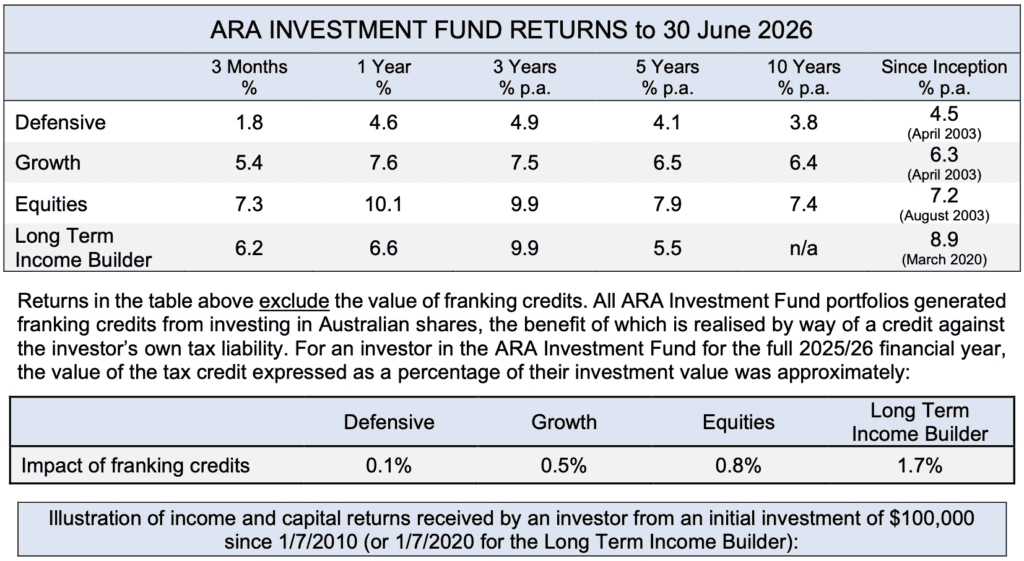
Returns quoted in this report are after all costs, and before the application of management fee rebates. Return figures are pre-tax, and include the value of franking credits from franked dividends. Total return figures assume the re-investment of gross distributions including franking credits. 3-month return figures are for the period to 30 June 2026 and are not annualized. Data source ARA Consultants Pty Ltd & Context Capital (except where indicated)
ARA Consultants Pty Ltd provides this update for the information of its clients and associates. If you do not wish to receive this or other information about ARA in future, please contact us on (03) 9853 1688.
This document has been issued by ARA Consultants Pty Ltd for its own use and the use of its clients. Fundhost Limited (ABN 69 092 517 087) (AFSL No: 233 045) (Fundhost) is the issuer of the ARA Investment Fund (ARSN:104 232 448). Information contained in this document is general information and is not intended to constitute nor does it purport to offer any specific or individual investment advice. Whilst every effort has been made to ensure the accuracy of the information contained in this document, neither ARA nor Fundhost accept any liability in relation to anyone who makes and acts upon a decision based upon that information. No person should make a decision based upon the information contained in this document without first seeking and obtaining the appropriate professional advice relevant to their own individual circumstances and financial needs. You should consider the Product Disclosure Statement in deciding whether to acquire, or continue to hold the product. The PDS and applicable Target Market Determinations are available at www.araconsultants.com.au or by contacting ARA by phone on (03) 9853 1688 or by email at info@araconsultants.com.au. We also caution that past returns are just that, and the fact that they have been achieved previously does not guarantee or imply that they will be achieved again.
If you would like a pdf version of this update for your files you can download it here: June 2026 Quarter Investment Update.