
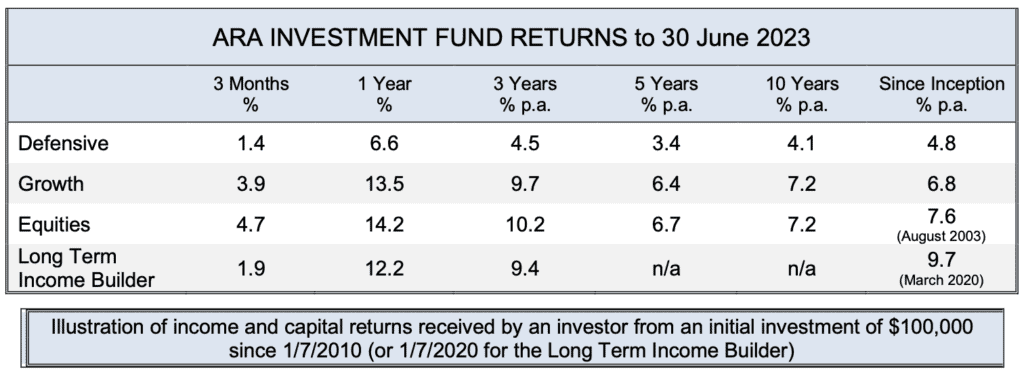
It’s great to be able to report good results to our investors, and as it happens, this year’s numbers are indeed comparatively good by industry standards.
It’s a fact that on a few occasions in our fund’s 21-year journey we have been near the top of the tree in terms of 1-year results. But we’ve learned not to make too much of a big deal about it, because sometimes you have it, sometimes you don’t. Different styles of money management have their day in the sun in different sets of circumstances, other times it’s like wading through quicksand.
The really pleasing part though, is that we’re fond of saying we aim to do well when markets are shaky, and the last four years have been about as volatile as they come, what with Covid, inflation and interest rate surges, and the impact of a dreadful conflict in Europe. But across that period we have been able to deliver solid overall performance while protecting investors’ capital.
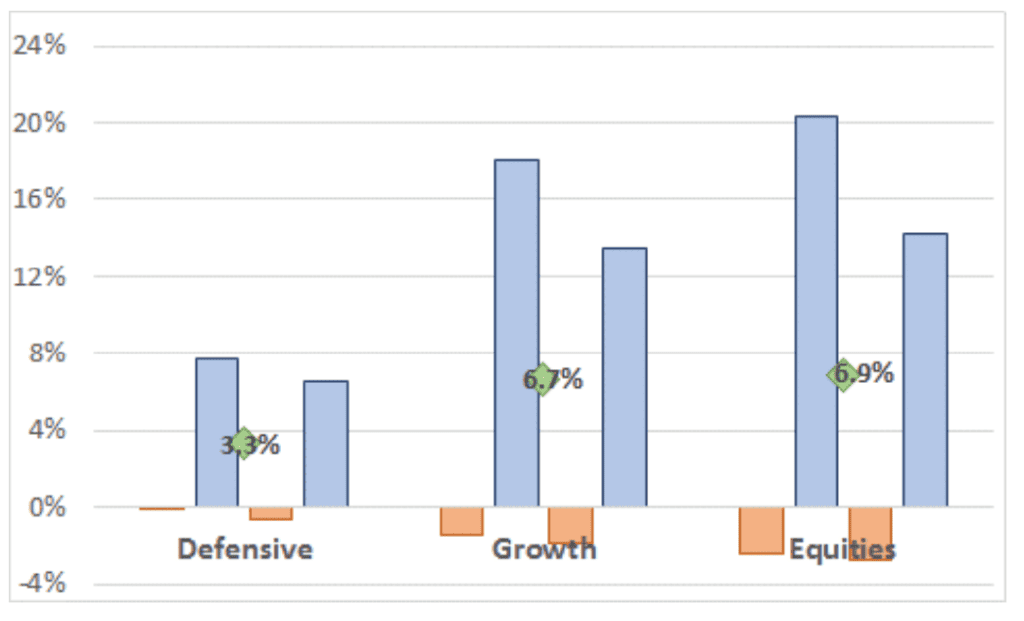
The bars in the above chart show the annual returns from the diversified portfolios for each of the past four financial years, while the green diamond is the four-year compound average return.
The Top 20
In most of our quarterly updates we publish a list of the largest 20 individual holdings (excluding bank deposits and annuities) with a descriptor that says these will have the biggest bearing on the portfolios’ returns. The heavy lifters you might say.
So it’s instructive to look back at what assets made up the Top 20 this time last year and see how they went.
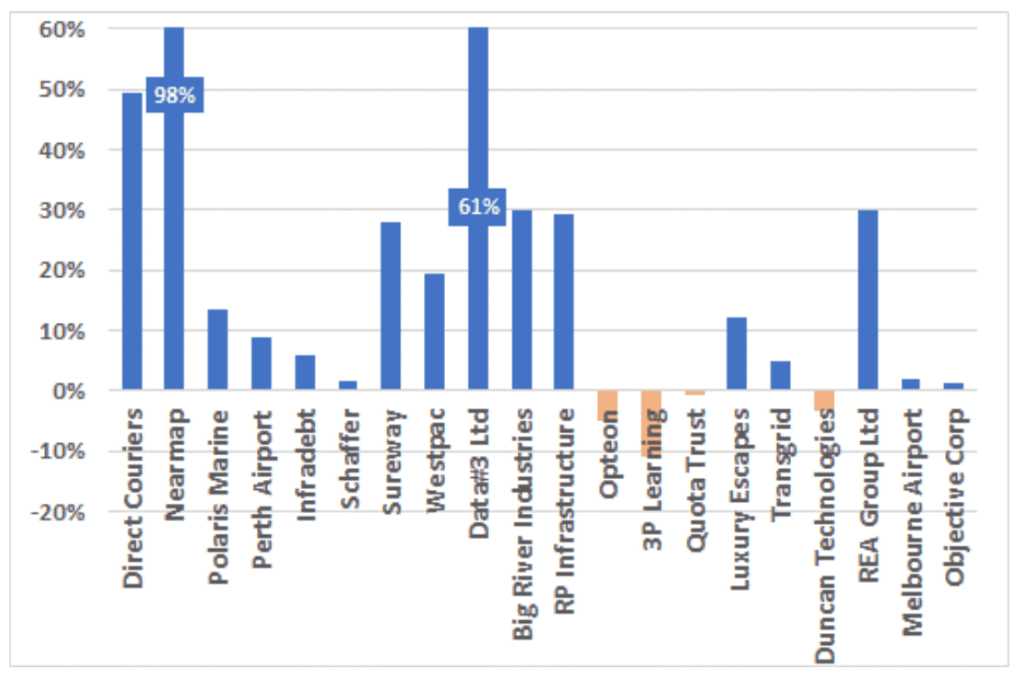
Three of the 20 didn’t quite get into the black. But there were a couple of off-the-scale blinders and seven of the twenty did over 25% for the year. Which goes a long way towards explaining the year’s solid results.
Income
Rounding out a good year is the observation that the income component of the annual return was another healthy one.
You’ll recall from the last update that as well as the table of total portfolio returns, we now also show the components of the return – unit price movement and annual income receipts.
The volatility of returns – and in particular the negative years that tend to be the cause of the most angst for investors – are generally a function of short term price movement. But as we note in a number of articles in our Retirement Hub on the website:
Price volatility is only a problem if you have to sell at a bad time, i.e. when prices are down
Understanding your longer term cash needs – and how much of it will be met by sources such as your investment income and other things like age pension – is key to managing investment risk
In particular, knowing if, when and in what quantity it will be necessary to sell things is an invaluable tool for managing investors’ risk.
So a strong income return is a good thing. The 2021 financial year was an odd one for income as companies curtailed dividend payments in response to Covid measures – banks were in fact forced to by the regulators. In 2022 income bounced back as there was room for a bit of catch up, while this past year was solid.
In that context it might be opportune to take a closer look at what those charts tell us, and what to expect from each portfolio. Let’s start with the newest one first.
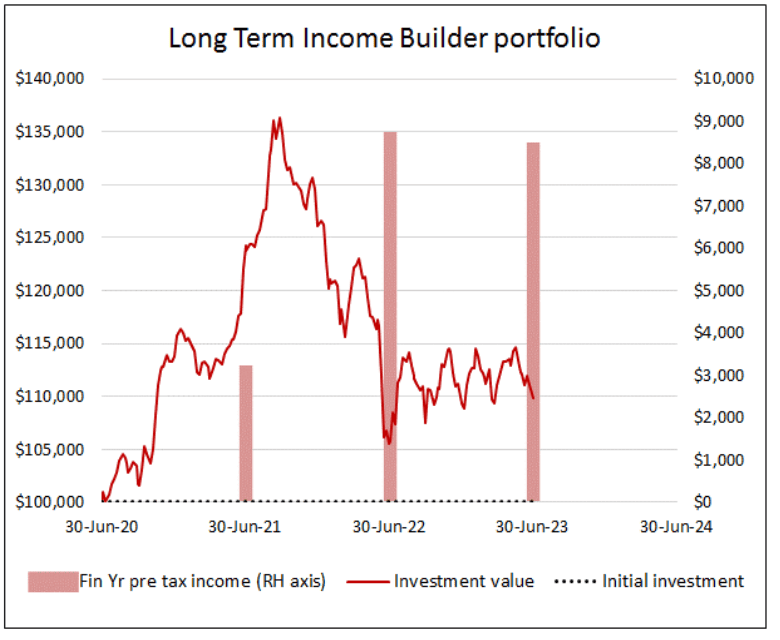
The Long Term Income Builder
This portfolio in fact has income as its primary objective, derived mainly from shares listed on the Australian Stock Exchange – shares chosen for their history and prospects of solid and growing dividend income. So the price line will resemble, although not exactly mirror, the movement of the stock market. The income bars should show consistent growth over time, and also be somewhat higher than the market average. Indeed that’s what happened this past year.
Over time this portfolio will probably deliver the highest return of the four, but with the most short term price volatility. So although it is 100% liquid, it’s a long-term buy-and-hold job.
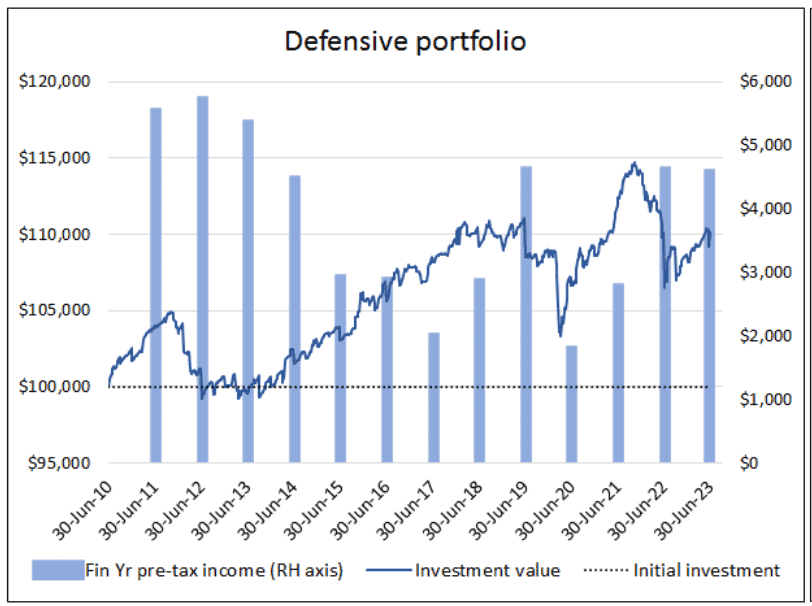
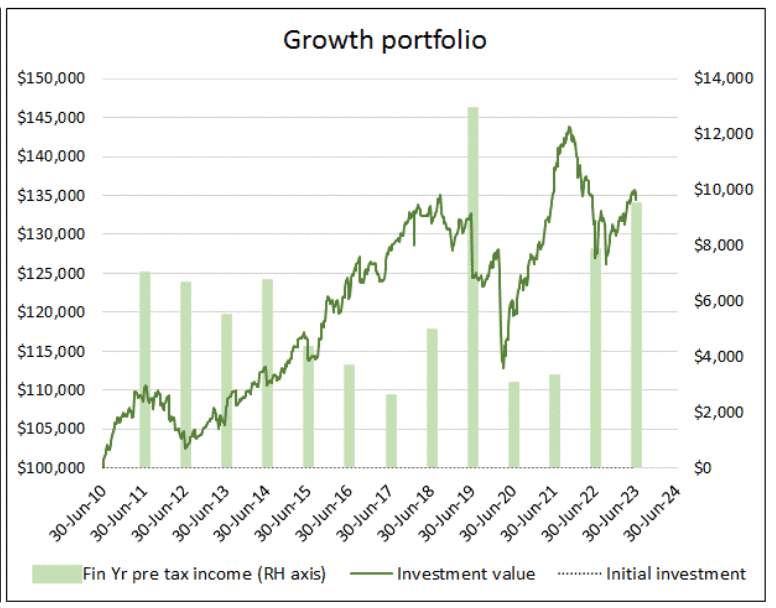
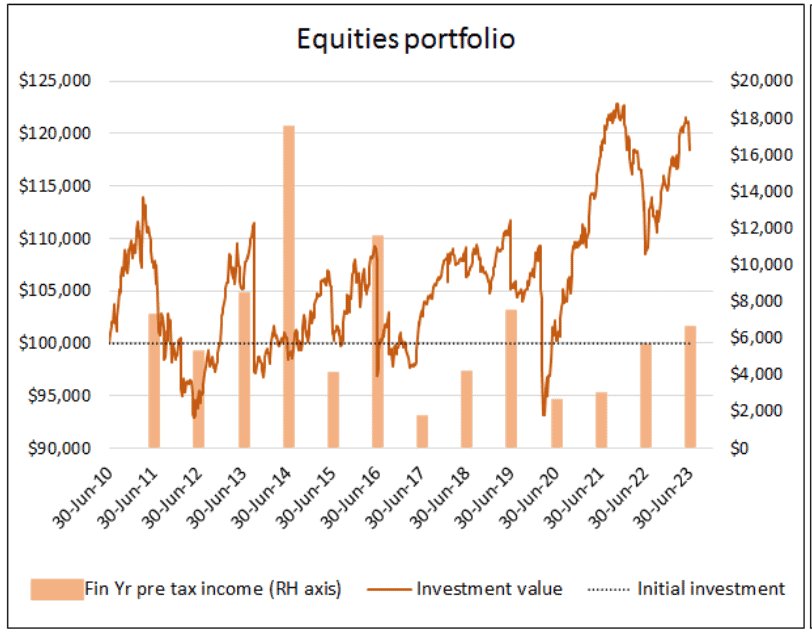
Defensive, Growth, Equities
The other portfolios invest in varying degrees in a range of assets other than just Australian shares, in order to, among other things:
access alternative opportunities
dampen the price volatility
They are unlikely to produce the same amount of income as the Income Builder. Although having said that, from time to time there will be larger than normal cash payments, which are generally the result of a sale of an asset and the distribution of the realised profit. A good example from this past year was the sale of Nearmap to an American company, which resulted in a substantial profit being realised and a larger than normal cash distribution.
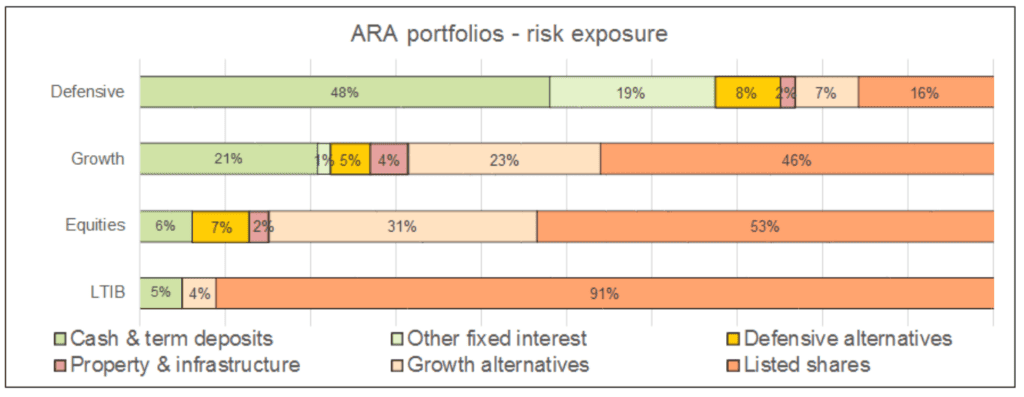
So by design the ARA portfolios cover a broad spectrum of income and price volatility characteristics, making them suitable for different investment timeframes and investor needs. These characteristics are integrated into the workings of our Retirement Income Projector, and the process of advising clients on the right portfolio mix for them.
A reminder – notwithstanding that we recently introduced a separate fee schedule for personal financial advice, all investors are welcome to seek advice relating to their investment in our funds, without additional charge.
ARA Super – Year end process – what to expect.
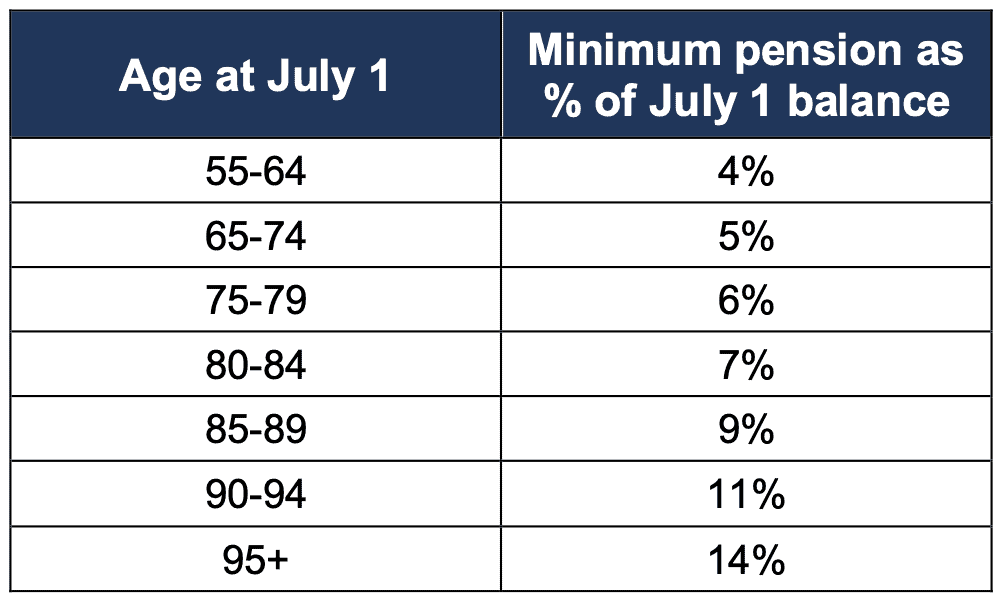
July pension payments should already have been received. As we have previously mentioned, the concession that allowed pension recipients to reduce their annual minimum payments by 50% has been rescinded, and so annual minimums will revert to the statutory age-based limits, namely:
Another change for super and pension clients is in respect of tax (no it’s not bad news!).
A reminder that accumulation account earnings are taxed at a maximum rate of 15%, while pension accounts are exempt. Both types of account are eligible to receive the benefit of any franking credits their investments earn.
In the past these tax impacts were calculated and applied at the fund level, and reflected in the unit price that applied to all investors. Under the new ARA Super platform, tax is calculated at the individual’s account level and tax is deducted or refunded to each member’s account.
In short, for pension members and potentially some accumulation members as well, you may see a cash deposit in your super account some time early in the new financial year, which is your tax refund.
So, who’s got what?
The table below shows the ARAIF’s investments at the time of writing. Please note, the percentages refer to the proportion of each portfolio allocated to that investment, not its rate of return.
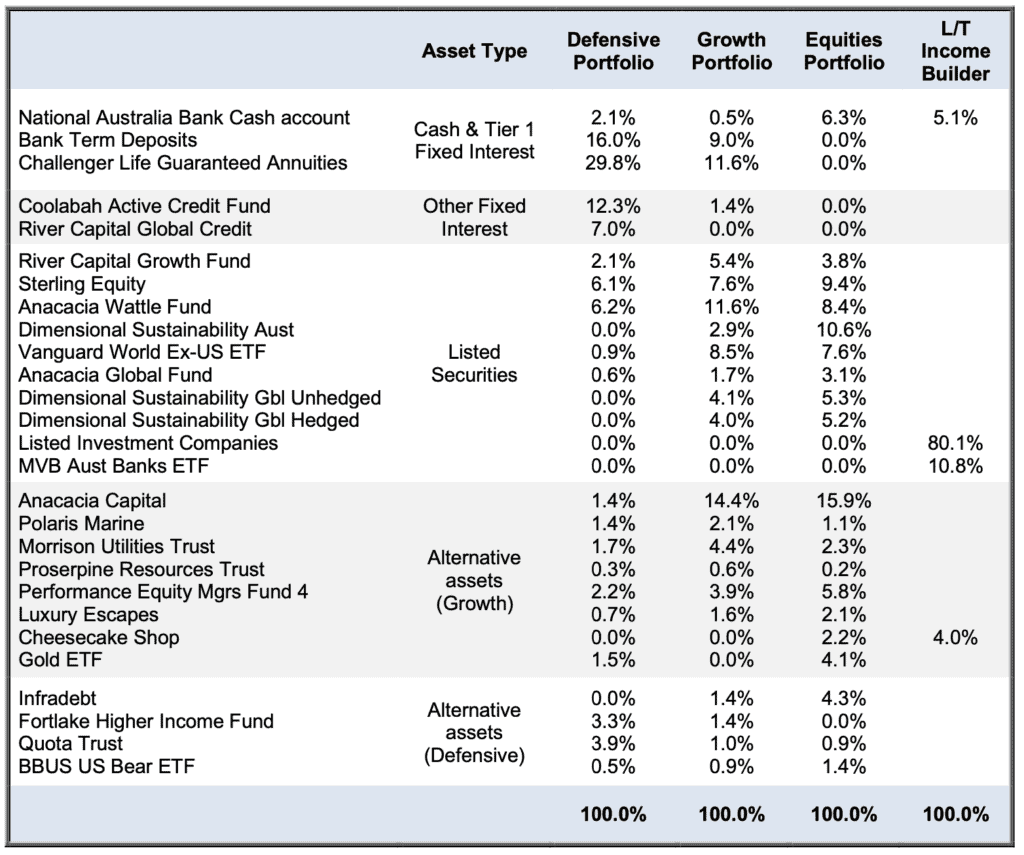
Major Holdings – diversified portfolios
Apart from bank deposits and other interest-bearing accounts, Defensive, Growth and Equities portfolios invest in a range of assets through the fund managers listed in the table above. If we drill through to the assets selected and overseen by those managers, there are in fact over a hundred individual securities providing diversification of risk and exposure to a wide range of opportunities.
The table below shows the 20 largest individual holdings and what proportion of each portfolio they represent. These are the investments that will have the biggest impact on the portfolios’ returns.
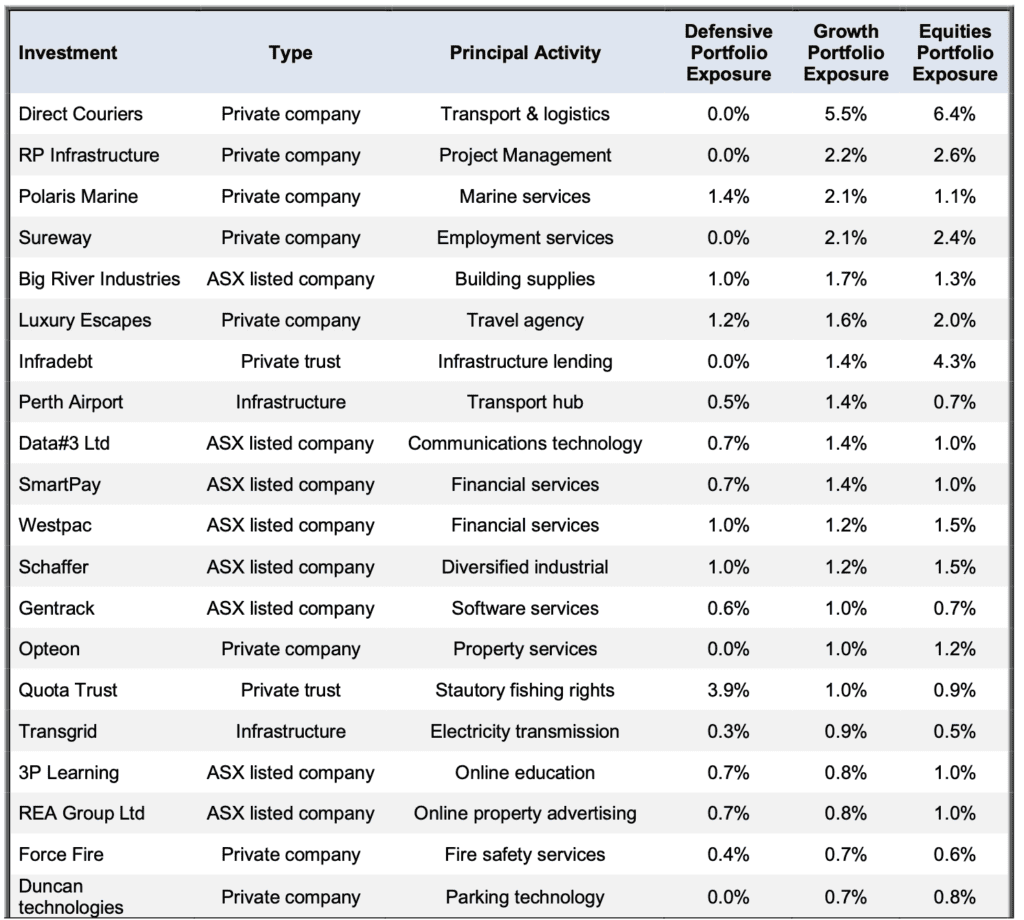
Returns quoted in this report are after all costs, and before the application of management fee rebates. Return figures are pre-tax, and include the value of franking credits from franked dividends. Total return figures assume the re-investment of gross distributions including franking credits. 3-month return figures are for the period to 30 June 2023 and are not annualized.
ARA Consultants Limited provides this update for the information of its clients and associates.
This document has been issued by ARA Consultants Limited for its own use and the use of its clients. Fundhost Limited (ABN 69 092 517 087) (AFSL No: 233 045) (Fundhost) is the issuer of the ARA Investment Fund (ARSN:104 232 448). Information contained in this document is general information and is not intended to constitute nor does it purport to offer any specific or individual investment advice. Whilst every effort has been made to ensure the accuracy of the information contained in this document, neither ARA nor Fundhost accept any liability in relation to anyone who makes and acts upon a decision based upon that information. No person should make a decision based upon the information contained in this document without first seeking and obtaining the appropriate professional advice relevant to their own individual circumstances and financial needs. You should consider the Product Disclosure Statement in deciding whether to acquire, or continue to hold the product. The PDS and applicable Target Market Determinations are available at www.araconsultants.com.au or by contacting ARA by phone on (03) 9853 1688 or by email at info@araconsultants.com.au. We also caution that past returns are just that, and the fact that they have been achieved previously does not guarantee or imply that they will be achieved again.
If you would like a pdf version of this update for your files you can download it here: June 2023 Quarter Investment Update.