
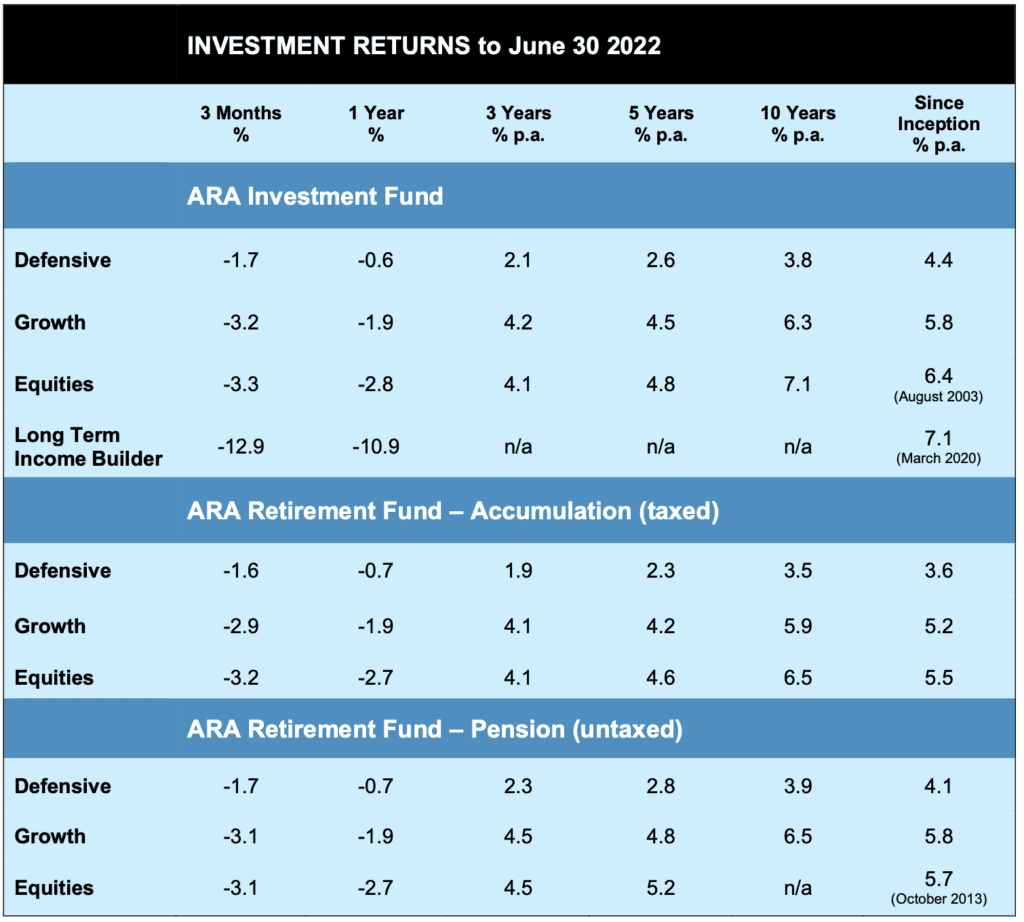
In the wake of some pretty severe turbulence in investment markets this past year, regrettably the annual returns were in the red.
While times like these are undoubtedly taxing and difficult for investors, it’s worth keeping in mind that, in the short term, the most significant factor affecting investment markets is, quite simply, the news!
“The market” – that is, the gaggle of participants out there jostling to buy or sell something – react to news in a way that affects what they feel inclined to pay for something on the day. If the news is good, the market is optimistic and will pay more. If the news is bad, we get the opposite.
As a basis for making investment decisions this is somewhat fraught. The daily news is both unpredictable ($12 lettuces??) and subject to the old media maxim that mountains sell more papers than molehills.
By contrast, in the long run the key driver of investment returns is earnings. That is, profits earned by the companies whose shares you own, rent from the properties you own and so on.
This makes sense. A company that earns two million dollars a year should be worth more than one which earns one million. Earnings underpin the income you receive and the value of your investment. Furthermore, if earnings grow, so will your income and the value of your investment.
Fortunately this long term driver (earnings) is relatively well-behaved compared with the news cycle. Decades of history have shown that the underlying trend in earnings is positive, which is ultimately reflected in asset values despite the short term wobbles.
The chart following serves to illustrate the point. It depicts the returns delivered by the Australian stock market over various time periods since January 1980. The blue bars depict the range of returns over rolling periods of 1, 5, 10 and 20 years, while the diamond dots within the bars show the average return for the same periods.
A few things stand out, including:
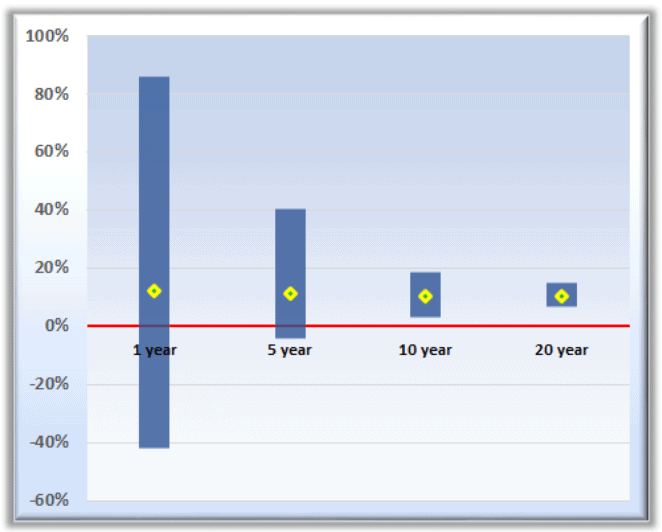
The average return is much the same regardless of the time period, but the short term volatility is reflected in the dimensions of the blue bars. 1-year returns have varied between -42% and +86%, while the worst return over a 20-year period was +6.8% per annum.
- Clearly negative returns are a feature of the 1-year outlook – in fact nearly a quarter (22.4%) of the time the yearly result was in the red. By the time you get to 10-year results and beyond, there were no instances of negative returns.
Focusing on earnings rather than the news gives you at least a sporting chance of assessing the future compared with trying to pick tomorrow’s headlines. When thinking in terms of earnings, what matters is:
Their current level
Whether and by how much those earnings can be expected to grow
- The going price being paid for those earnings, compared with historic norms
There’s enough info around to take a reasonable stab at these things and therefore to derive some comfort around future outcomes. This can then be compared with current interest rates – does the expected return represent a fair reward compared with what you could get by leaving your money in the bank?
We often refer to the Fabulous Fridge Chart – sometimes a bit tongue-in-cheek, but it is in fact a very useful tool for illustrating exactly this process. So what is it saying now?
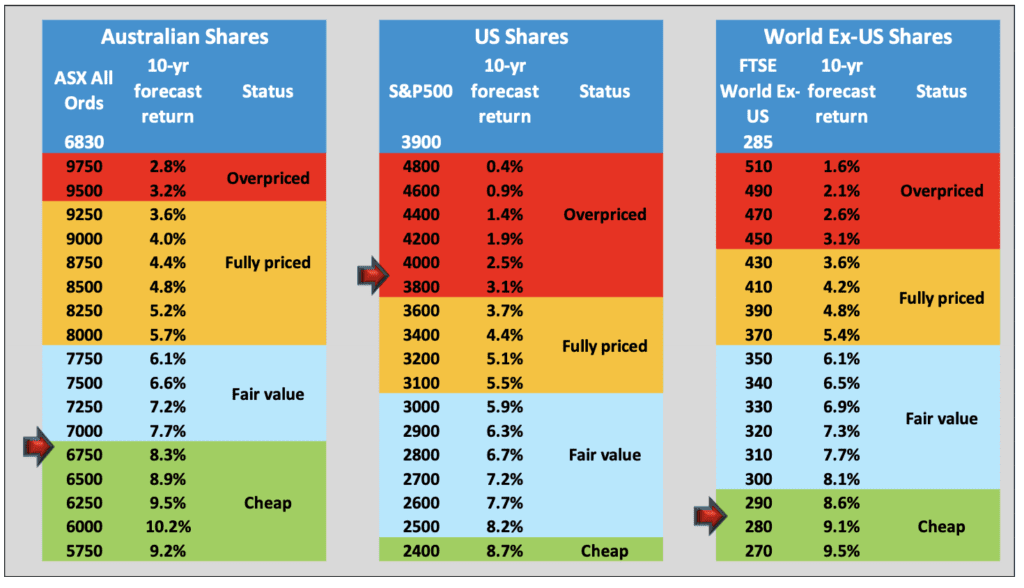
At the time of writing, and following the recent market falls, both the Aussie stock market and the World outside of the US are now regarded as very good value, while the US still looks expensive. Not much change from last time, except that the markets actually look cheaper!
This all goes to the question we are often asked in times like these – “What should we do now?” Very often, and quite understandably, the investor’s inclination is to sell up and play it safe. This is potentially disastrous. It should be borne in mind that:
- Falls like we have recently experienced are unrealised losses, brought about by fluctuation in market prices (usually related to the short-term news cycle);
- It is not a permanent loss of capital – unless you act to crystallise those losses at depressed market prices. This is a common reaction, but is also a classic destroyer of wealth;
Assets that are most susceptible to downwards fluctuation in price are also likely to be the ones that will recover more quickly when market conditions normalise. The fall in price has in fact made them more attractive to own, not less.
So while it might seem counter-intuitive at the time, selling up after a downturn has the effect of crystallising what were unrealised losses, while at the same time impeding the return in the eventual upswing. The difficulty is that the timing is unknowable. Things may get worse before they get better, but if the market has already tumbled and current valuations look good, the time to dive for safety has passed.
In our portfolios, whereas at this time last year we were cashing in some profits, we are now lining up our cash resources to deploy more funds into growth assets, at valuations that are suddenly more attractive than they were a short time ago.
Long Term Income Builder
With this in mind it might be timely to mention our newest offering. It was the portfolio most affected by the short term issues referred to above, being exposed solely to the one market without the diversification or hedging effects that live in the other portfolios.
But as we repeatedly point out, its main game is income, and despite the temporary fall in its valuation, the portfolio delivered an income yield of 4.8% for the year, plus franking credits. We anticipate a full recovery in its underlying price in due course.
So, who’s got what?
The table below shows the ARAIF’s investments at the time of writing. Please note, the percentages refer to the proportion of each portfolio allocated to that investment, not its rate of return.
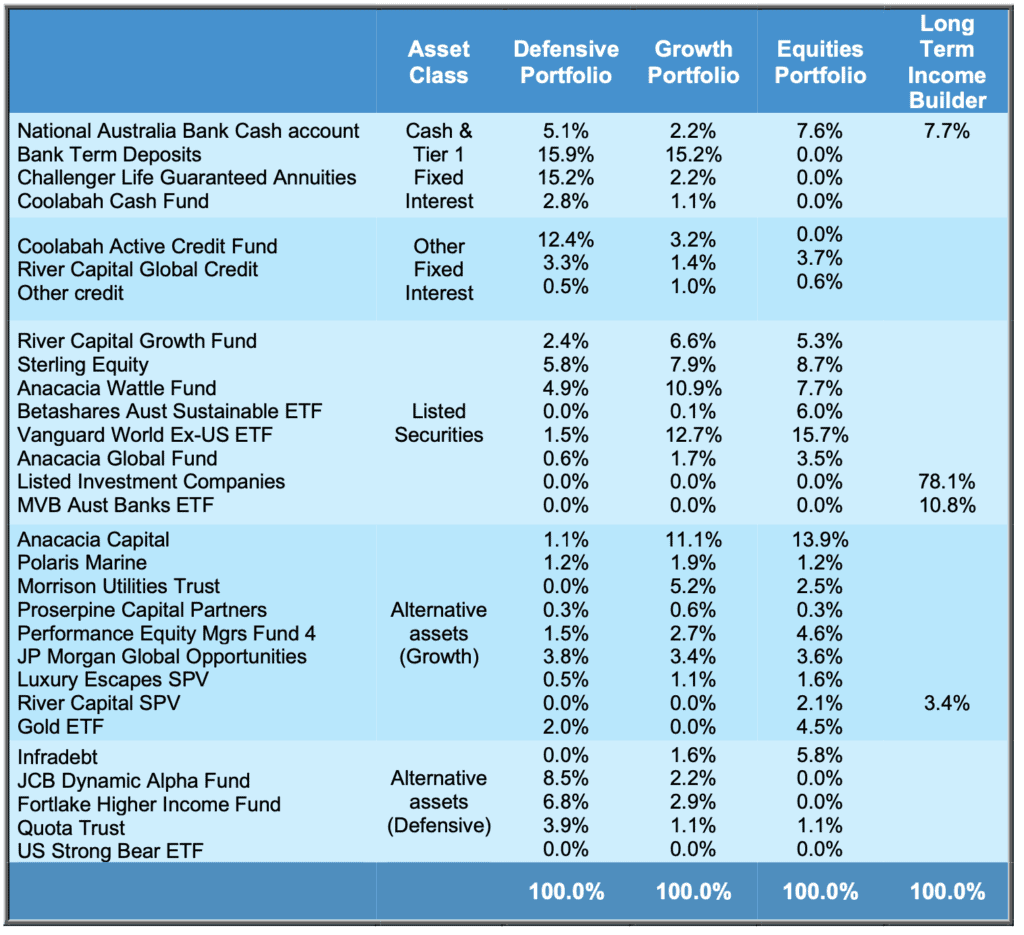
Major Holdings – diversified portfolios
Apart from bank deposits and other interest-bearing accounts, Defensive, Growth and Equities portfolios invest in a range of assets through the fund managers listed in the table above. If we drill through to the assets selected and overseen by those managers, there are in fact over a hundred individual securities providing diversification of risk and exposure to a wide range of opportunities.
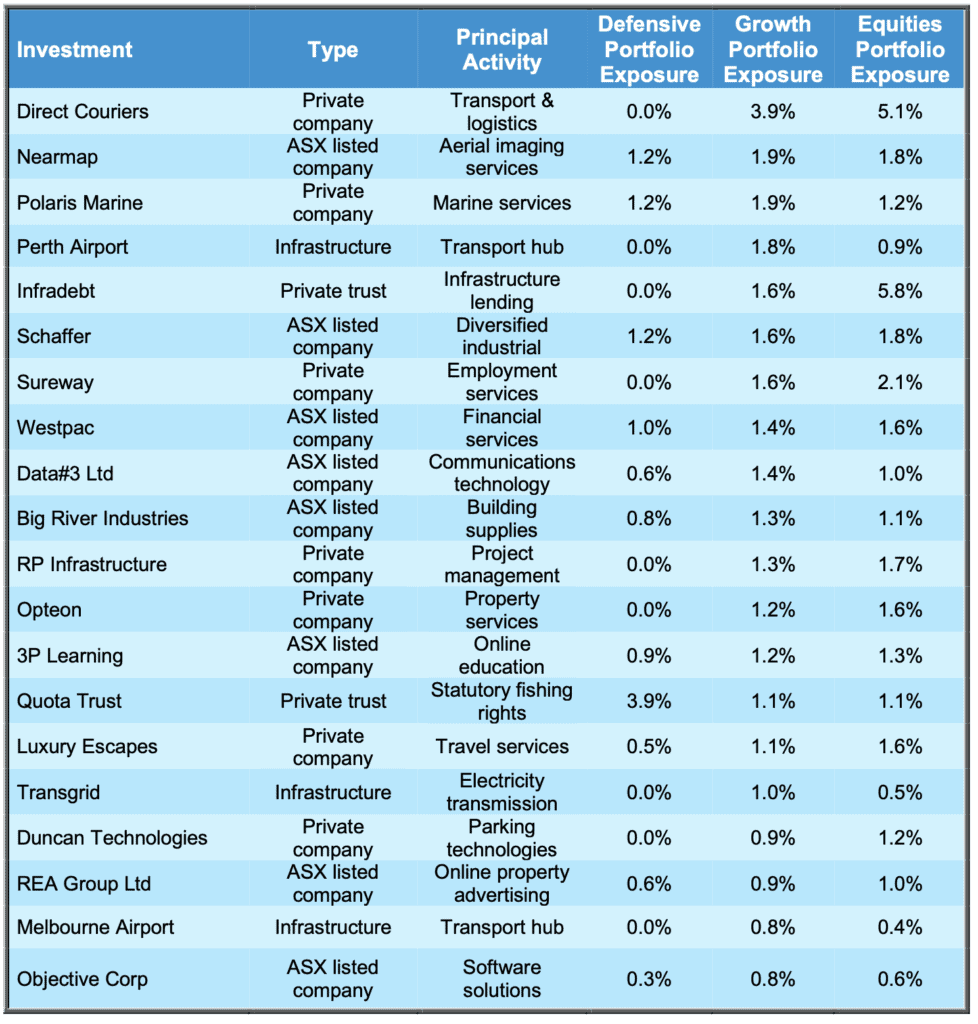
The table below shows the 20 largest individual holdings and what proportion of each portfolio they represent. These are the investments that will have the biggest impact on the portfolios’ returns.
This document has been issued by ARA Consultants Limited for its own use and the use of its clients. Fundhost Limited (ABN 69 092 517 087) (AFSL No: 233 045) (Fundhost) is the issuer of the ARA Investment Fund (ARSN:104 232 448). Information contained in this document is general information and is not intended to constitute nor does it purport to offer any specific or individual investment advice. Whilst every effort has been made to ensure the accuracy of the information contained in this document, neither ARA nor Fundhost accept any liability in relation to anyone who makes and acts upon a decision based upon that information. No person should make a decision based upon the information contained in this document without first seeking and obtaining the appropriate professional advice relevant to their own individual circumstances and financial needs. You should consider the Product Disclosure Statement in deciding whether to acquire, or continue to hold the product. You should also refer to the relevant Target Market Determination (TMD) for the product. The PDS and applicable TMDs are available at www.araconsultants.com.au or by contacting ARA by phone on (03) 9853 1688 or by email at info@araconsultants.com.au. We also caution that past returns are just that, and the fact that they have been achieved does not guarantee they will be achieved again.
If you would like a pdf version of this update for your files you can download it here: July 2022 Investment Update.