
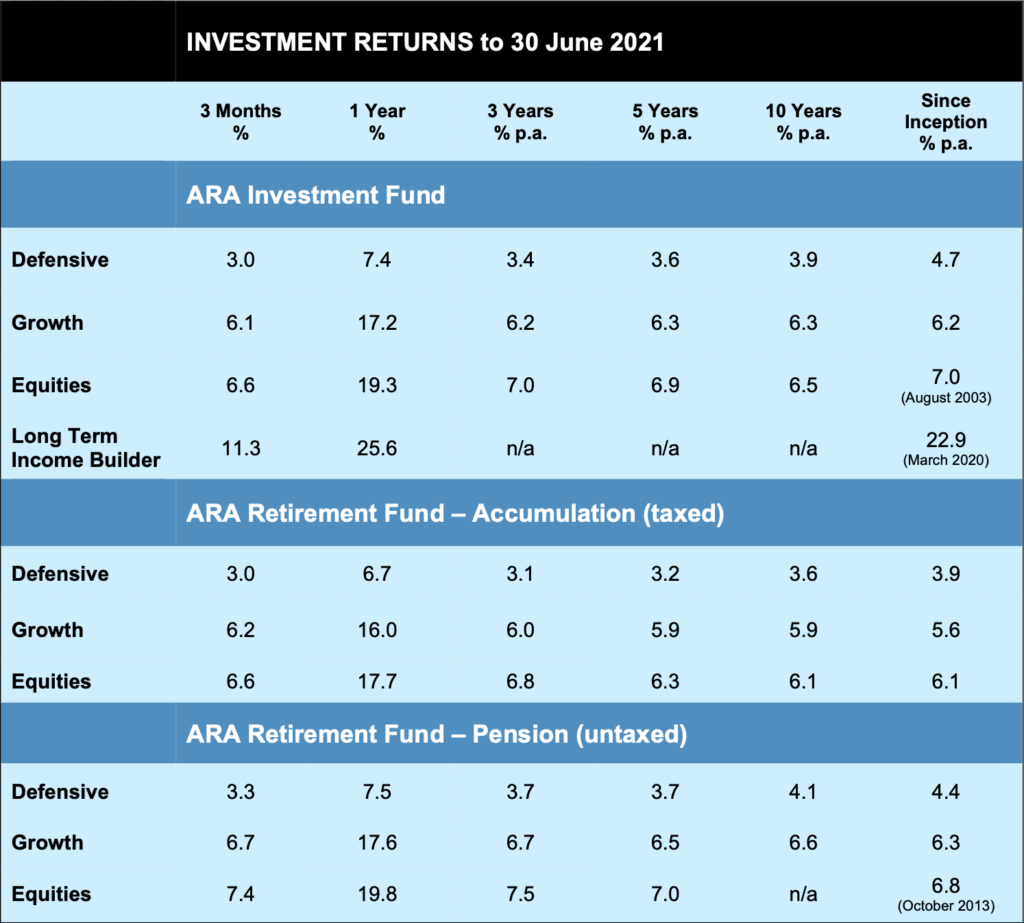
The recovery that began in the June quarter of last year has continued on right through this past financial year, enabling strong returns to be credited to our investors.
In fact, given that interest rates and inflation are at such historic lows, these are among the best “real” rates of return we’ve seen since the inception of our funds.
It’s almost as if the downturn in the first half of 2020 was a strange dream. If it seems like it came and went in the blink of an eye, in historical terms that’s not far from the truth.
In the past 40 years, there have been eight instances in which the Australian stock market fell by more than 20%, so it’s not an uncommon occurrence. See the table below.
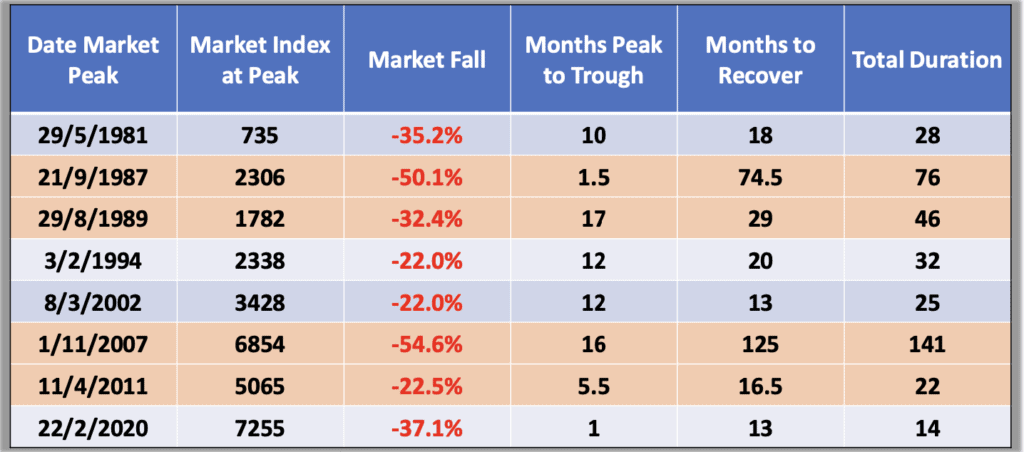
The table shows the extent of each fall, how long it took to get from the top to the bottom, then how long to get back again. (Those events shaded in orange are interesting in that the next big downturn occurred before the recovery from the previous one was complete!)
As to this latest downturn, you will note:
It was pretty savage – the third biggest fall in the past 40 years;
It was also quick, the quickest from peak to trough in the table;
However, the recovery was also the quickest, meaning that the whole thing was over in 14 months, the quickest of all such similar events in this period.
If there is a moral to this story it would be along the lines of:
Big downturns happen regularly, on average every five years.
There is always a recovery, but sometimes it can take a long time, unlike this latest one.
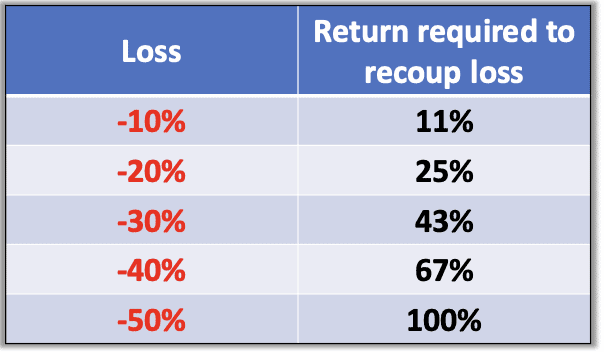
And as we’ve often said, a good way to hasten the recovery is to limit the fall in the first place, as per the maths in the table below.
For the record, the stats for the ARA portfolios in respect of the latest downturn were:
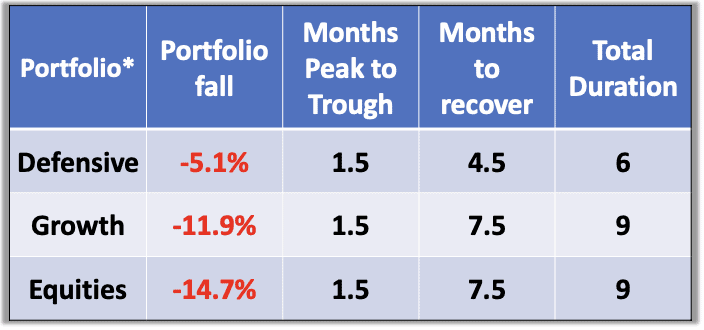
*Fortunately the Long Term Income Builder portfolio avoided the downturn altogether – more about that later.
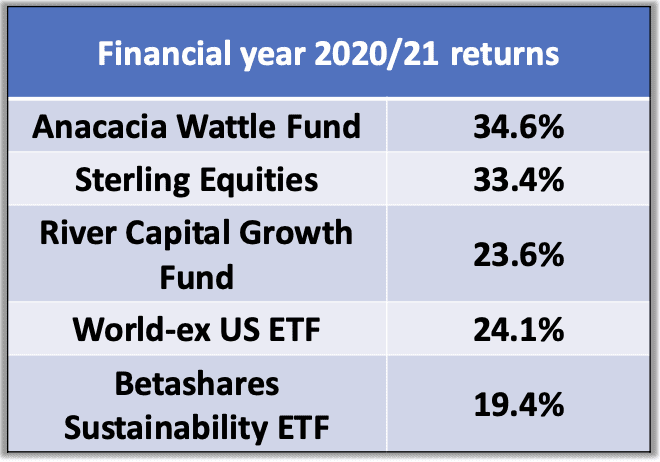
Where did the returns come from?
Pretty much across the board really, except for cash holdings which, as we’ve said before, are not there for stellar returns, but for liquidity and capital protection.
Among the largest holdings of “risk” assets – that is, the things that are meant to do the heavy lifting to generate incremental return above the cash rate – the major stock market holdings all did pretty well.
We also got useful contributions from a number of private company investments. Of note, Cobram Estate, everyone’s favourite Olive Oil producer, announced plans to list on the stock market, which has allowed a re- assessment of its book value – up about 56% for the quarter with maybe a bit more to come when the actual listing happens. A really good local success story!
So, what now? Things have run pretty hard for some time, spurred on by ultra-low interest rates and massive stimulus programmes around the world aimed at assisting recovery from the pandemic effects and stimulating economic growth. But there is no shortage of risks either. What’s the plan from here?
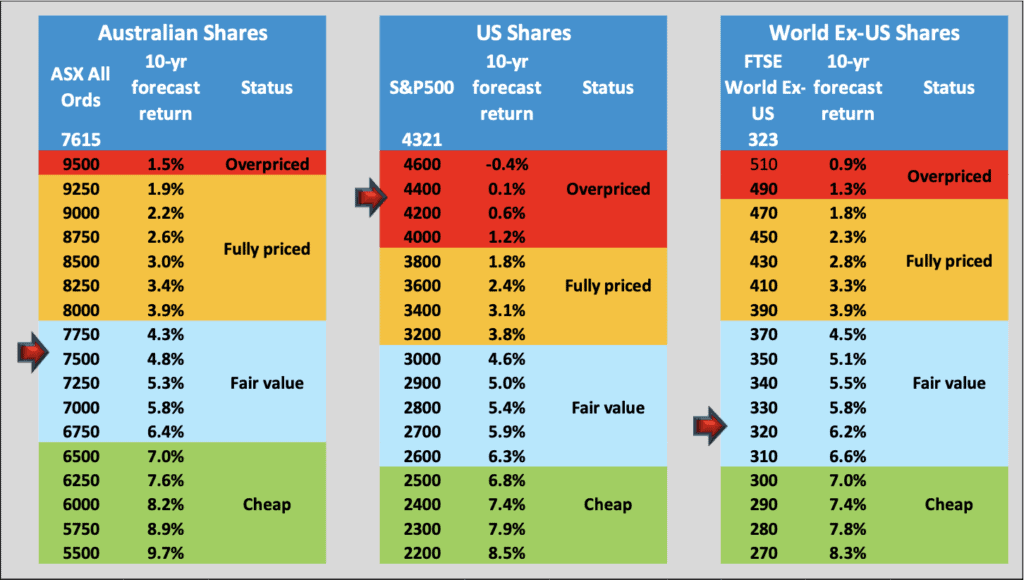
Well, it’s back to the fabulous fridge chart for a clue – see below. According to the chart, US shares remain off-the-dial expensive. But, despite having moved up considerably, it seems there is still value in the Australian stock market at current levels, and major markets outside the US.
So that remains our position in the diversified portfolios. Strong performance dictates that we take some profits off the table and thereby de-risk the portfolios somewhat, but for now we maintain target weightings or thereabouts in Australia and the World ex-US with little or no direct exposure to the US.
Long Term Income Builder
Our latest portfolio offering (aka my new best friend) completed its first full financial year with something of a flourish, although maybe not in exactly the way it was envisaged.
To recap, the aim behind this portfolio is to provide an attractive income stream arising from dividends paid by companies listed on the Australian Stock Exchange. That income target is around 4% per annum plus franking credits, with some underlying growth in value as well to keep pace with inflation.
The core of the portfolio is a range of large Listed Investment Companies (LICs) – companies that trade on the stock market whose principle business is investing shareholders’ funds in a range of other companies. Those we have chosen have a specific mandate of generating stable, growing dividend income streams.
In fact for its first year the portfolio’s gross dividend yield will be more like 3%. This is largely because in the wake of the pandemic many companies cut their dividends to preserve cash and shore up the shop. In fact the banks, traditional dividend favourites, were ordered by the regulator APRA to restrict their dividend payouts.
In the meantime though, the portfolio appreciated in value by over 20% for the year. As consolation prizes go, could be worse! This was in part due to fortunate timing in avoiding the market downturn in early 2020 and subsequently being able to buy up stocks at lower prices. And then late in the year one of our largest holdings, Milton Corporation, announced a merger with WH Soul Pattinson, which pushed its price up over 20%. Handy.
We would expect things to revert to a more “normal” situation in the coming year or two – that is, a higher dividend yield and a more realistic growth rate. There is plenty of suggestion that companies will restore their dividend payments, and APRA has lifted its restriction on the banks – in fact there are whispers of special extra dividends from banks that find themselves flush with cash.
So we have taken the opportunistic step of adding additional bank exposure to the portfolio, at least for the short-medium term, to take advantage of this possibility.
If we do a “look-through” to see which companies make up the bulk of the portfolio, it currently looks like this:
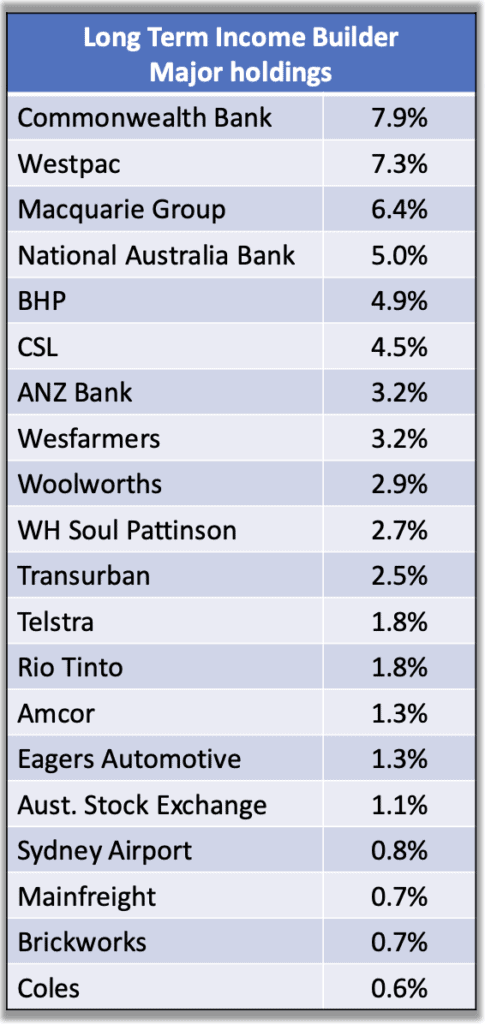
These are the 20 largest holdings at present, accounting for just over 60% of the portfolio. As mentioned, by design it’s a bit bank-heavier than usual in anticipation of a pick-up in banks’ dividends. This will normalise in due course.
It’s also worth noting that companies usually pay dividends twice a year. We pay out income as and when it is received, so typically the Long Term Income Builder will also generally pay two distributions a year, not four.
So, who’s got what?
The table below shows the ARAIF’s investments at the time of writing. Please note, the percentages refer to the proportion of each portfolio allocated to that investment, not its rate of return.
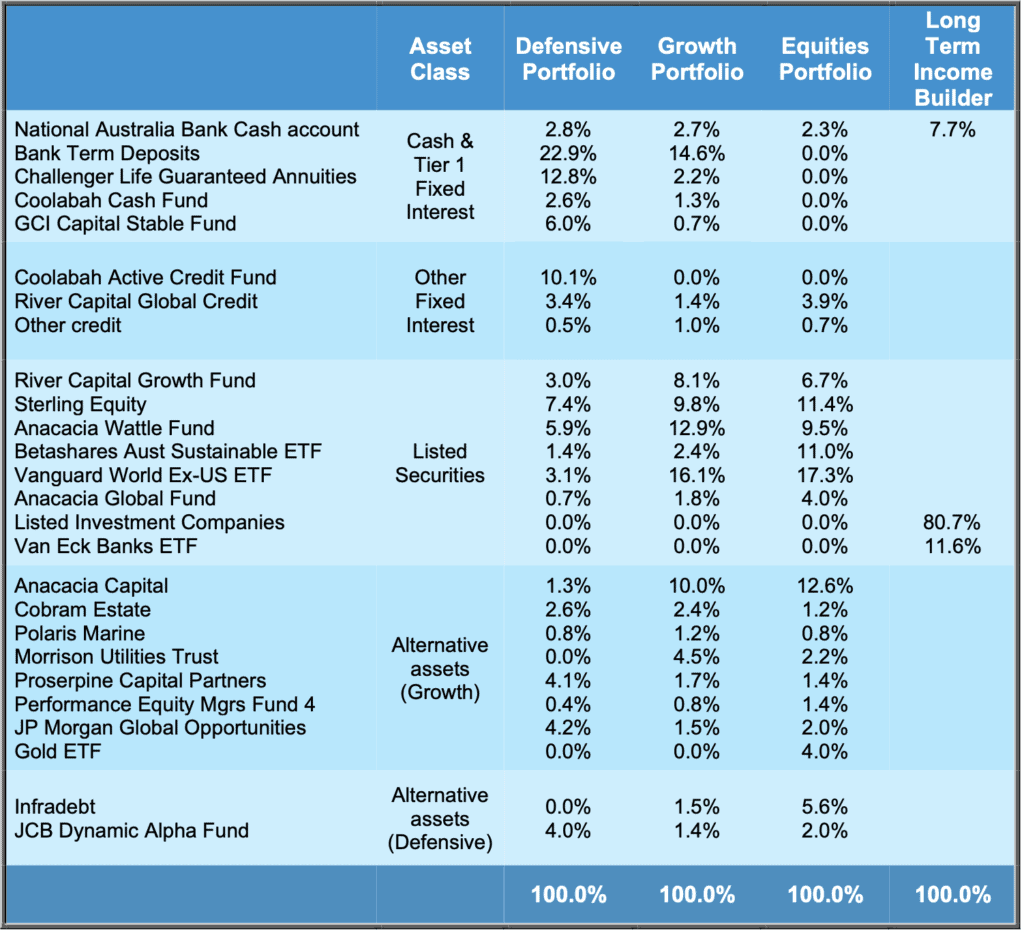
Major Holdings – diversified portfolios
Apart from bank deposits and other interest-bearing accounts, Defensive, Growth and Equities portfolios invest in a range of assets through the fund managers listed in the table above. If we drill through to the assets selected and overseen by those managers, there are in fact over a hundred individual securities providing diversification of risk and exposure to a wide range of opportunities.
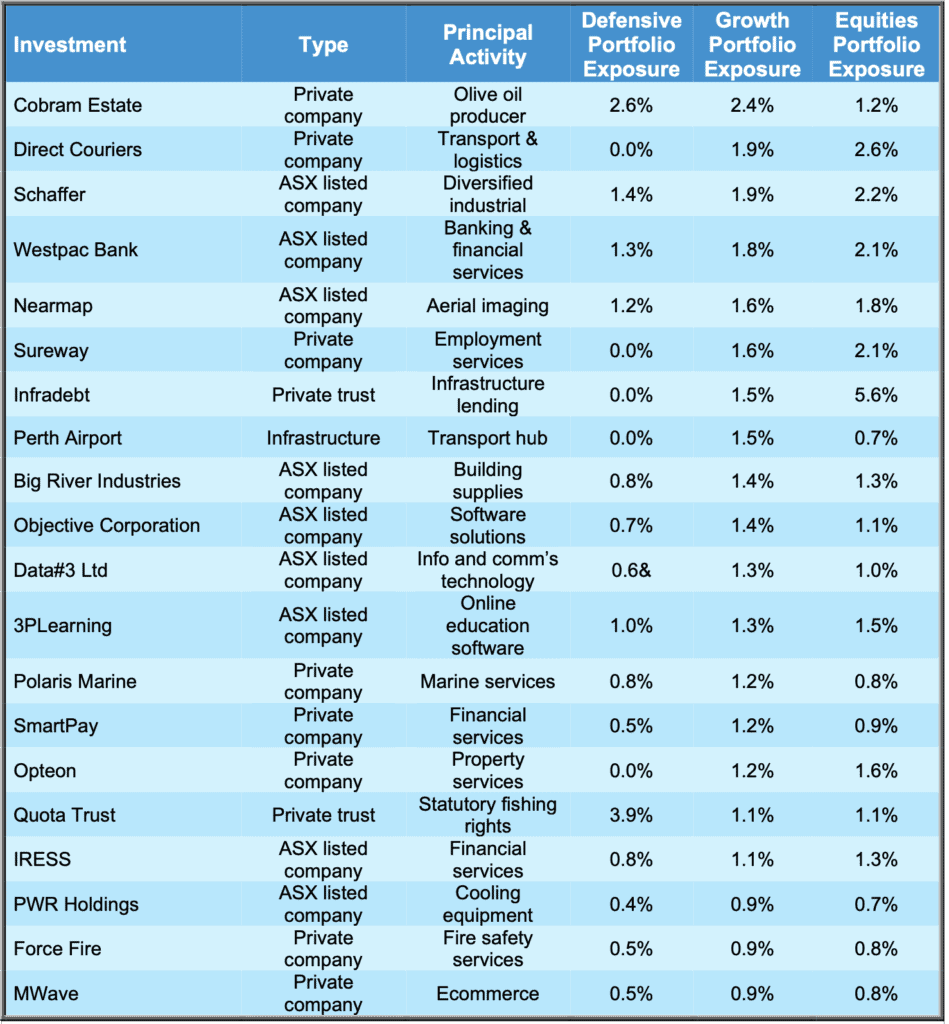
The table below shows the 20 largest individual holdings and what proportion of each portfolio they represent. These are the investments that will have the biggest impact on the portfolios’ returns.
If you would like a pdf version of this update for your files you can download it here: July 2021 Investment Update.