
Some years back I was listening to the finance report on the news, and was informed that “the market” (aka the Australian share market index) had passed through the 5400 point mark.
Something about this sounded familiar. Maybe it was a slow day, but I decided to investigate because I was pretty sure I’d heard that one before.
I got more than I bargained for. It turns out that based on the closing value at the end of each business day, the All Ordinaries index of share prices has now passed through the 5400 mark a total of 83 times. It first hit that mark in November of 2006. Over the next fifteen years or so it fell back through 5400 41 times and rose back above it 41 times, including most recently in May 2020, which may or may not be the final time.
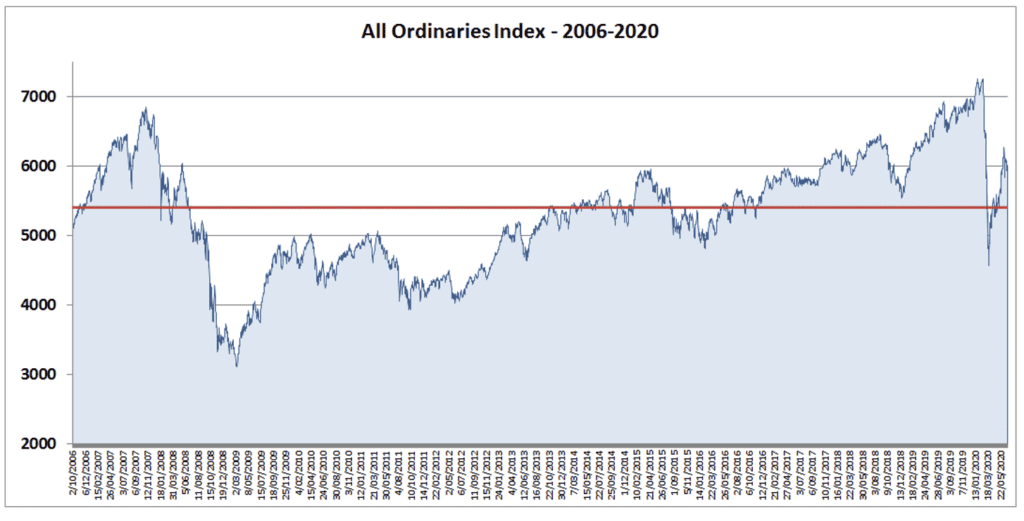
Along the way it got as much as 34% above the 5400 starting point, and 42% below it, to basically end up back where it started. No wonder the stock market has a reputation for being a risky, volatile place. And what great fodder for the daily news cycle! Market up, market down, a crisis here, billions wiped off super funds there………
So what did the poor beaten-up share investors get for being stupid enough to take on such a risky proposition? Well, we know that in capital value terms they made nothing. But the chart below shows the annual return to the investor on a hypothetical investment of $100,000 in the ASX All Ords placed at the start of 2006.
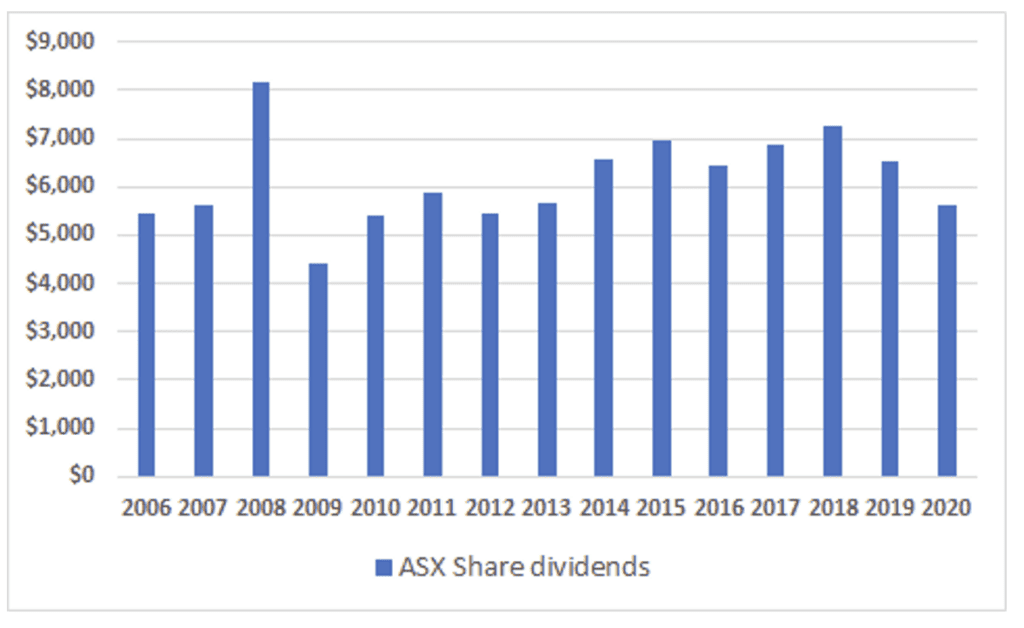
This is the gross dividend income stream. A different kettle of fish altogether, albeit from the same source. Looks pretty rock solid to me.
For the record, let’s compare it with the secure alternative of bank term deposits. In this chart the term deposit income stream assumes a starting investment of $100,000 again, in a 1-year term deposit paying the cash rate at the time + 1% p.a. At the end of each year the deposit is rolled over at the new rate. So again, after fifteen years you’ve got your starting capital but received income payments along the way.
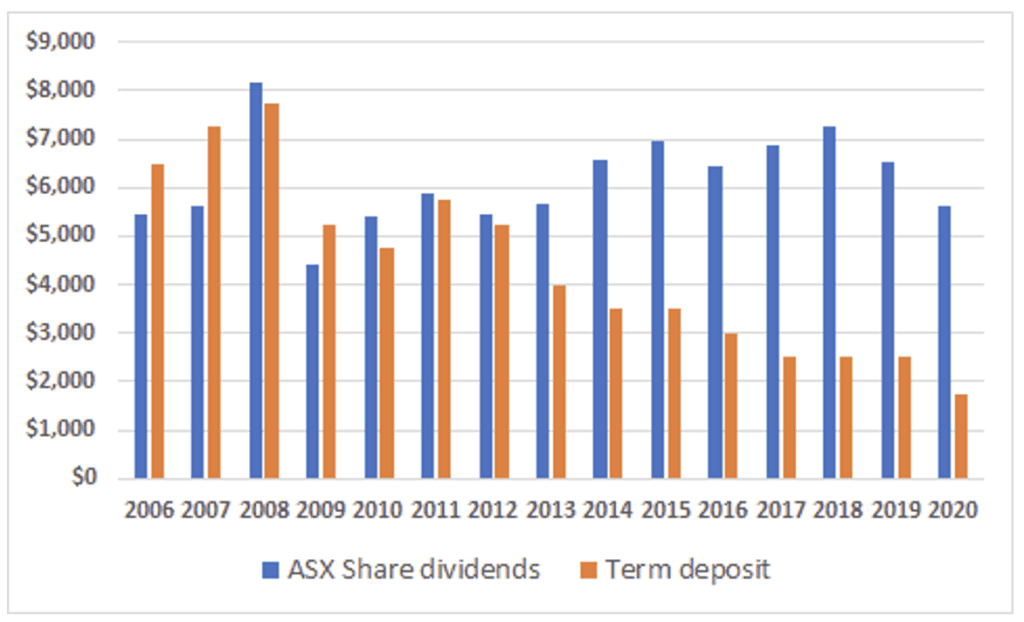
This is not cherry-picking convenient data points. Yes the time period includes some historically low interest rates, but it was also one of the worst 15-year periods in the history of the Australian share market. It included the once-in-a-lifetime downturn now fondly remembered as the GFC, the COVID hit and sundry other crises along the way. Yet the total income return for the share investor was more than 40% greater than for the TD investor.
Why is it that no-one ever talks about dividend income when they’re reporting on “the market”? The obsession with daily price movements is unhealthy, gives a distorted and incomplete picture of the typical outcome actually experienced by investors, and at worst can lead to poor choices and unnecessary stress. And it’s frankly irrelevant if you’re a long term holder.
The concept of investment risk has come to be dominated by this singular fixation with short term price volatility. What about the risk to living standards in retirement and longevity of capital, brought on by foregoing 40% of the potential income return?
An investor in something that displays short term price volatility has nothing to fear if their affairs are arranged such that they don’t have to sell at a bad time. It’s as simple as that. We talk more about this here if you’re interested.
Maybe it’s best not to listen to finance reports.
All Ordinaries data: www.spglobal.com
Dividend data: Australian Tax Office.
Interest rates data: Australian Bureau of Statistics.